coinpaper.com
Solana is trading near $100 after a sharp rally gave way to short-term selling pressure, leaving $SOL at a technical crossroads between a deeper correction and renewed upside. The one-hour chart points to possible downside toward $94.83-$90.46, while the daily structure shows a potentially bullish moving-average crossover developing beneath price.
Solana’s Wave 4 Correction Puts $94.83 Support in Focus
More Crypto Online sees the latest decline as part of a wave 4 correction after $SOL lost micro support and broke below the lower boundary of its rising channel. The one-hour setup suggests the pullback may still be unfolding as wave C before the larger bullish structure can attempt another advance.
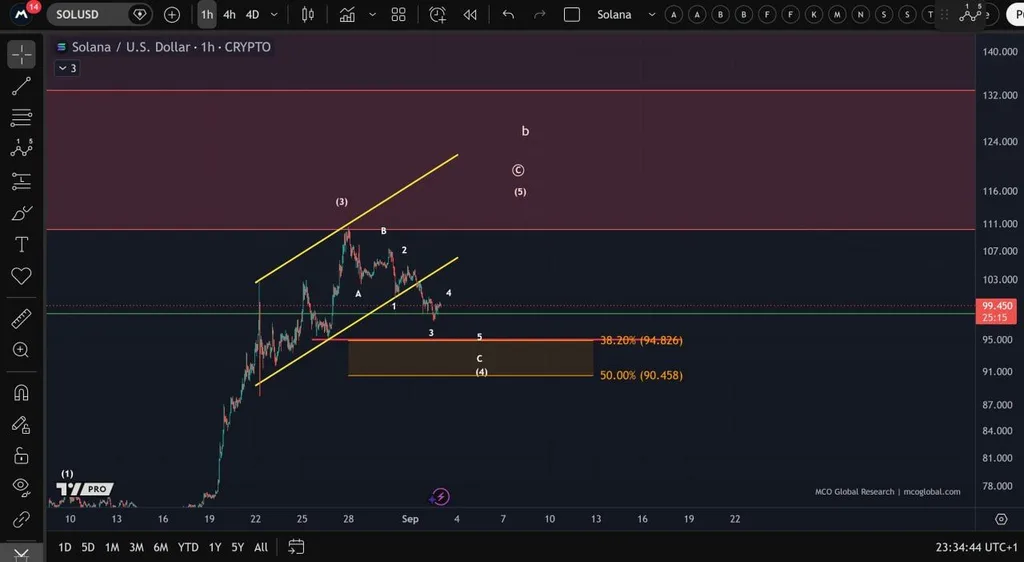
The chart shows $SOL retreating from a recent high near $109 after failing to hold the ascending channel that guided the previous advance. Price was near $99.45 when the chart was captured, putting it below the broken channel support and leaving sellers in control of the immediate trend.
The clearest downside levels are the Fibonacci retracement marks at $94.826 and $90.458. The first represents the 38.2% retracement level, while the second marks the 50% retracement. Together, they form the main support zone for the wave 4 scenario.
A reaction above $94.83 would strengthen the case that the correction is approaching completion. $SOL would then need to reclaim the broken channel area and push through the recent $103-$107 region before a retest of resistance near $111 becomes more convincing.
A sustained break below $90.46 would weaken the displayed wave structure and raise the risk of a deeper correction rather than the relatively contained wave 4 pullback shown on the chart.
$SOL Daily Chart Shows Moving Averages Near Bullish Crossover
Crypto Rover highlighted a potentially bullish development on Solana’s daily chart as the 50-day simple moving average closes in on the 100-day average. The setup follows $SOL’s strong rebound from the mid-$70 area and its recent surge above both longer-term trend indicators.
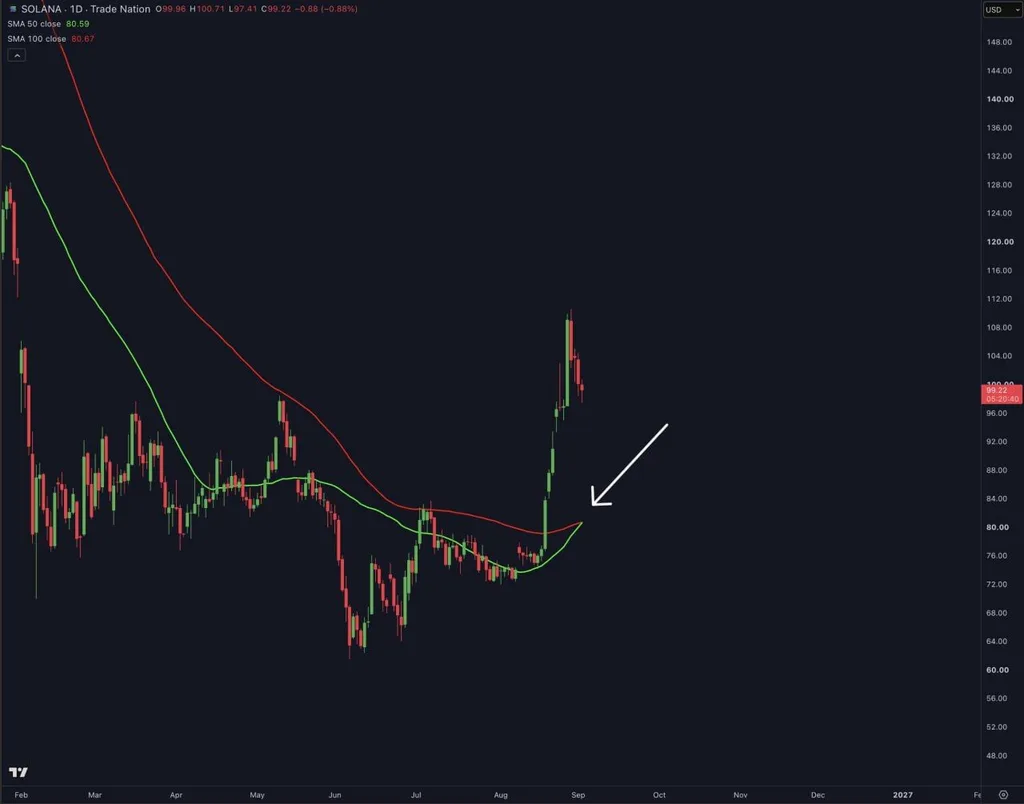
The chart lists the 50-day SMA at $80.59 and the 100-day SMA at $80.67. That means the bullish crossover was not yet fully confirmed at the displayed values, but the gap had narrowed to just a few cents, making confirmation possible if the shorter average continues rising.
$SOL also remains well above both moving averages despite its retreat from roughly $109 to around $99. That keeps the broader daily recovery intact even as the one-hour chart warns of additional near-term weakness.
Confirmation would come from the 50-day SMA moving decisively above the 100-day SMA while $SOL continues holding above its recent breakout region. On the upside, the $104-$109 area is the immediate hurdle, followed by the more important resistance around $111.
The technical signals therefore point to different time horizons rather than directly conflicting outlooks. $SOL could extend its short-term correction toward $94.83 or even $90.46 while maintaining an improving daily trend, provided the larger breakout structure does not unravel.
Solana was changing hands around $100 early Thursday, Sept. 3, after being among the major cryptocurrencies pressured during Wednesday’s broader risk-off move. Global markets showed signs of stabilizing Thursday as Treasury yields eased, but uncertainty around U.S.-Iran tensions and expectations for the Federal Reserve remain important outside drivers for risk assets.