
Can Illumina Stock Break $220 Resistance To Hit $235 Target?

Illumina stock closed at $218.22 on September 4, holding within a well-defined uptrend above all major moving averages. Elevated daily ATR of 10.27 signals conviction behind the move, though short-term momentum shows early signs of deceleration.
Summary
Key takeaways
- ILMN closed at $218.22 on September 4, with a daily range of $213.95–$219.58 and ATR at 10.27.
- The daily trend remains bullish, with price well above EMA20 ($210.64), EMA50 ($197.13), and EMA200 ($158.01).
- Daily RSI14 at 58.61 leaves room for upside, but the MACD histogram has turned slightly negative at -0.23.
- The hourly chart confirms bullish bias with positive MACD; the 15-minute chart shows a neutral consolidation pause.
- Key levels: daily R1 at $220.55, S1 at $214.92; a break above R1 would target the upper Bollinger band near $235.42.
The broader picture is straightforward. The daily trend is bullish, the hourly chart confirms it, and only the 15-minute timeframe flashes a short pause. That is normal rhythm inside a strong uptrend, not a warning sign. However, it does mean traders need to be selective about entry timing rather than chasing every green candle.
Daily Structure: A Trend That Has Room to Run
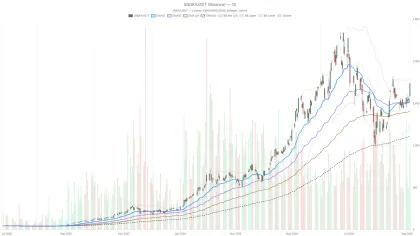
The daily chart confirms a strong bullish trend for Illumina stock, with price stretched well above all major moving averages. RSI sits comfortably in bullish territory without being overbought, leaving room for further upside.
ILMN is trading well above its EMA20 (210.64), EMA50 (197.13), and EMA200 (158.01). That spacing between short- and long-term averages signals an established uptrend rather than a fragile bounce. The regime reading is tagged bullish, and the price action backs that up.
RSI14 sits at 58.61, comfortably bullish without being overbought. Meanwhile, the MACD tells a more nuanced story. The MACD line is at 6.77, below the signal line at 7. However, the histogram has slipped to -0.23. In practical terms, momentum is decelerating even though the trend remains firmly up.
Bollinger Bands add important context. Price sits between the mid-band (208.52) and the upper band (235.42). There is still technical room to extend higher before the stock becomes stretched on a volatility basis. The daily pivot sits at 217.25, with resistance at R1 220.55 and support at S1 214.92. Those levels mark the near-term battle lines.
Hourly Chart: Bullish Bias Remains Intact
The 1-hour timeframe supports the bullish thesis for ILMN. Moving averages are stacked bullishly. MACD shows a cleaner signal than the daily chart, helping offset the softer daily histogram reading.
EMA20 (216.4), EMA50 (215.67), and EMA200 (206.9) are all stacked bullishly, and the regime tag again reads bullish. RSI14 at 56.23 is neutral-to-firm, leaving plenty of headroom for continuation.
Notably, the hourly MACD is more constructive than the daily one. The line at 1.1 sits above the signal at 0.73, and the histogram is positive at 0.37. That is a clean bullish signal on this timeframe. The pullback in daily momentum has not yet translated into weakness on the hourly chart. If anything, the 1H tape is still pushing higher.
Price closed at 218.12 against an hourly pivot of 218.4, with R1 at 218.85 and S1 at 217.67. That tight range shows the stock consolidating around a key pivot point rather than breaking decisively in either direction.
15-Minute Chart: A Pause, Not a Reversal
The 15-minute chart shows a neutral consolidation phase rather than a bearish reversal. Compressed Bollinger Bands, near-flat MACD readings, and low ATR all point to the market digesting the recent move.
On this timeframe, RSI14 is at 52.13 — essentially neutral. The MACD histogram has turned slightly negative at -0.08, with the line (0.42) sitting just under the signal (0.51). Bollinger Bands have tightened, with the upper band at 219.14 and the lower band at 217.17, while ATR14 has dropped to just 0.61.
Taken together, that is a classic low-volatility consolidation signature. Price is compressing near the EMA20 (218.09), which sits almost exactly at the current close. For traders using this timeframe for execution, the market is pausing to digest rather than reversing. A break of either the 15m EMA structure or the tight Bollinger range would set the tone for the next intraday leg.
What Would Support the Bullish Case
A sustained break above daily R1 at $220.55 would strengthen the bullish case for Illumina stock. Confirmation from positive hourly MACD would open the path toward the upper Bollinger band near $235.42.
The bullish scenario leans on alignment across the daily and hourly timeframes. A sustained move through daily R1, backed by hourly MACD staying positive, would confirm continuation. Fundamentally, the recent Zacks Rank upgrade to Buy — tied to growing optimism about earnings prospects — adds a supportive backdrop. If daily RSI holds above 50 while price grinds higher without becoming overbought, that aligns with trend continuation rather than exhaustion.
What Would Invalidate It
The bullish structure for ILMN would come under pressure if price loses the daily EMA20 at $210.64. A break below S1 at $214.92 would amplify the concern. A deepening negative daily MACD histogram would add conviction to the bearish case.
The bearish risk centers on that daily MACD histogram turning more negative. A loss of the daily EMA20, or a break below S1, would start to challenge the current bullish structure. On the hourly chart, losing support at 217.67 would be an early tell that intraday bulls are losing control. There is also a fundamental angle worth noting. Recent commentary suggests Illumina stock looks priced more for growth than for value. Shares have re-rated sharply over the past year without a clear valuation anchor. That combination pairs a strong technical trend with a stretched multiple. It is exactly the kind of setup where profit-taking can accelerate once momentum stalls.
Closing Take
The weight of evidence still favors the bullish case for Illumina stock, with daily and hourly timeframes aligned. The 15-minute chart reflects a natural pause within a broader uptrend, not a reversal signal.
However, the softening daily MACD histogram is a detail worth watching closely. Given elevated ATR readings on both daily and hourly charts, volatility is likely to stay elevated. Positioning around key pivot levels seems more prudent than committing heavily in either direction. The market still needs to resolve this short-term momentum pause within the broader uptrend.
FAQ
Is Illumina stock still in a bullish trend?
Yes. The daily chart shows ILMN trading well above its EMA20 ($210.64), EMA50 ($197.13), and EMA200 ($158.01), with the regime reading tagged bullish. The hourly chart confirms this bias with bullishly stacked moving averages and a positive MACD.
What are the key levels to watch for Illumina stock?
On the upside, daily R1 at $220.55 is the immediate resistance; a break above targets the upper Bollinger band near $235.42. On the downside, S1 at $214.92 and the daily EMA20 at $210.64 serve as critical support levels. Losing those would challenge the bullish structure.
Is the current consolidation a warning sign for ILMN?
Not necessarily. The 15-minute chart shows a classic low-volatility consolidation with compressed Bollinger Bands and neutral RSI at 52.13. This is typical behavior within a strong uptrend and suggests the market is digesting recent gains rather than preparing to reverse.
What fundamental factors are supporting Illumina stock?
The recent Zacks Rank upgrade to Buy, driven by growing optimism about the company’s earnings prospects, provides a supportive fundamental backdrop. However, commentary also notes the stock appears priced more for growth than value after sharp re-rating over the past year.
Article produced with the assistance of artificial intelligence and reviewed by the editorial team.
Disclaimer: The content of this article solely reflects the author's opinion and does not represent the platform in any capacity. This article is not intended to serve as a reference for making investment decisions.
You may also like
Uzbekistan launches 1:1 som-pegged HUMO stablecoin pilot, trial to last 12 months
Gold reverses early gains as US Dollar rebounds, Oil prices rise
SanDisk stock surges 12% on S&P 100 news, but RSI flags overbought risk
AI: Anthropic Now Targets Mid-October for Its IPO

Crypto prices
More


