

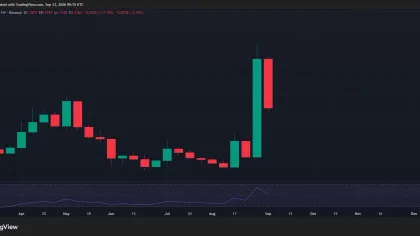
Dogecoin has entered a critical phase on its short-term price chart as analysts observe the development of a falling wedge pattern. This formation, typically viewed as a bullish reversal signal, has drawn heightened attention from traders assessing the cryptocurrency’s next potential move amid fluctuating momentum and robust derivatives interest.
Dogecoin forms falling wedge, eyes $0.150 target as derivatives activity rises
By:Cointurk
Bitget offers one-stop trading for cryptocurrencies, stocks, and gold. Trade now!
A welcome pack worth 6200 USDT for new users! Sign up now!
Technical outlook and key resistance levels
Dogecoin (DOGE) is currently trading around $0.0835, with its recent price action consolidating within a narrowing wedge. Analyst Crypto With Gopal has identified $0.100 as a significant marker and highlighted the $0.110–$0.120 price zone as a critical resistance band for the coin.
The falling wedge suggests that downward pressure may be easing, but any bullish outlook depends on a confirmed breakout above the wedge’s upper boundary. Crypto With Gopal has projected that, if DOGE manages to surpass this resistance, the price could advance to around $0.150, marking a strong recovery from the current levels.
Within his analysis, Crypto With Gopal emphasizes that $0.110–$0.120 stands as the initial major hurdle for Dogecoin bulls, and overcoming it could trigger renewed buying momentum that supports a broader uptrend.
Conversely, a failure to establish support above $0.0800 may expose DOGE to further downside risk. This support is now viewed as a critical threshold for short-term market positioning.
Momentum and volatility factors
Market momentum for Dogecoin has cooled following its earlier breakout in August, which briefly lifted the price near $0.10000 before encountering strong resistance. Currently, DOGE is trading below the 20-day Simple Moving Average, which sits at $0.08589, and within expanded Bollinger Bands. The lower band, now near $0.08003, could be a key stabilization point for traders if the price continues to slide.
Technical indicators reflect this subdued momentum. The moving average convergence divergence (MACD) indicator now registers weaker momentum, with the MACD line crossing below the signal line and negative histogram bars signaling that sellers still maintain short-term dominance.
Mini dictionary: Bollinger Bands – A technical analysis tool that measures price volatility using a set of upper and lower bands plotted around a moving average. When bands contract, it signals reduced volatility, and when they expand, it indicates increasing volatility.
A look at recent price action shows that after a period of low-volatility consolidation in July and August—when DOGE traded close to $0.07000—there was a breakout that faltered near $0.10000, causing a pullback to $0.08449.
Derivatives market highlights
Derivatives activity remains strong despite some cooling in trading momentum. According to Coinglass, Dogecoin’s 24-hour trading volume dropped by 3.10% to approximately $710.71 million, but open interest climbed 1.92% to around $1.27 billion. This pattern suggests traders are maintaining leveraged positions even as spot trading slows.
Metric Current Value Daily Change
| Spot price | $0.0835 | – |
| 24h trading volume | $710.71 million | -3.10% |
| Open interest | $1.27 billion | +1.92% |
| Open interest (DOGE) | 16.38 billion DOGE | – |
Data compiled by Dogegod also indicates that total open interest sits near 16.38 billion DOGE, valued at roughly $1.5 billion. Elevated positions in the derivatives market may heighten volatility once DOGE’s price escapes its current technical range.
With these developments, Dogecoin is at an important crossroads. Technically, bulls need to claim the $0.110–$0.120 zone to confirm a breakout from the falling wedge. A move through this barrier could validate a push toward $0.150, while a failure to hold $0.080 support may leave DOGE vulnerable to further losses. Market participants continue to monitor both technical patterns and sentiment indicators as they position for the cryptocurrency’s next move.
0
0
Disclaimer: The content of this article solely reflects the author's opinion and does not represent the platform in any capacity. This article is not intended to serve as a reference for making investment decisions.
Understand the market, then trade.
Bitget offers one-stop trading for cryptocurrencies, stocks, and gold.
Trade now!
You may also like
Crypto market’s weekly winners and losers – VVV, LSK, ARB, ENA
AMBCrypto•2026/09/13 21:03
Algorand eyes $0.10037 resistance as buyers defend key support
Cointurk•2026/09/13 20:36
Nu digital bank launch expands into the U.S. with 3.50% APY accounts
Cryptonomist•2026/09/13 20:30
XRP Price Prediction: Bulls vs. Bears Ahead Of FOMC Week
Coinpedia•2026/09/13 20:30

Crypto prices
More
Bitcoin
BTC
$77,297.43
+0.08%

Ethereum
ETH
$2,508.95
-0.57%

Tether USDt
USDT
$0.9996
-0.01%

BNB
BNB
$722.21
-0.63%

XRP
XRP
$1.36
-0.47%

USDC
USDC
$0.9999
+0.01%

Solana
SOL
$101.26
-0.25%

TRON
TRX
$0.3413
+0.43%

Hyperliquid
HYPE
$78.51
-1.29%

Zcash
ZEC
$1,096.31
-2.32%
How to buy BTC
Bitget lists BTC – Buy or sell BTC quickly on Bitget!
Trade now
Become a trader now?A welcome pack worth 6200 USDT for new users!
Sign up now