
Zscaler, Inc. stock jumps 12% to $189.46 as overbought RSI clouds the rally

Zscaler, Inc. stock surged sharply to $189.46, closing near the day’s peak amid a broader cybersecurity rally. CrowdStrike and Zscaler each jumped 12% as AI safety warnings drove investors toward security names. The company’s Q4 2026 earnings confirmed ARR reaching $3.8 billion with 25% growth.
Summary
Key takeaways
- Zscaler, Inc. stock closed at $189.46 after jumping 12%, reclaiming the daily EMA200 at $180.59.
- ARR reached $3.8 billion with 25% growth, confirmed in the Q4 2026 earnings call.
- Daily RSI14 at 60.51 remains constructive, but the MACD histogram is still negative at -1.24, leaving the trend unconfirmed.
- 1H RSI14 at 80.46 and 15-minute RSI14 at 85.67 signal overbought conditions across short timeframes.
- Key support sits at the daily pivot of $183.50; resistance targets R1 near $196.29.
Daily Bias: Constructive but Not Yet Fully Confirmed
The daily bias for Zscaler, Inc. stock leans constructive but lacks full momentum confirmation. Price has reclaimed the EMA200 at $180.59, yet the daily MACD has not caught up with the move.
The MACD line at 1.76 remains below the signal line at 3, producing a negative histogram of -1.24. This lagging indicator has not confirmed the breakout. Yet price structure and the EMA200 reclaim both argue for a bullish shift. The daily regime reading of ‘neutral’ captures this tension precisely.
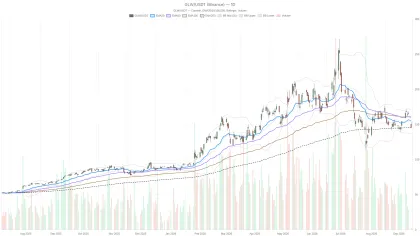
Meanwhile, Bollinger Bands show price at $189.46 trading close to the upper band at $194.01, with the mid-band at $176.52. That positioning signals the stock is pushing into the upper range of its recent volatility envelope. Typically, this precedes either a momentum extension or a pause. ATR14 at 10.67 confirms daily volatility has expanded meaningfully.
Notably, pivot levels reinforce that Zscaler, Inc. stock is now testing important territory. The daily pivot sits at $183.50, with price well above it, and resistance at R1 near $196.29. Support rests at S1, $176.66. As long as price holds above the pivot, the structure favors buyers. A slip back under $183.50 would cast doubt on the breakout’s durability.
1H Timeframe: Strong Confirmation, But Overbought
The 1-hour chart offers clear bullish confirmation, with price trading well above all three EMAs. However, overbought RSI readings raise near-term caution.
On this timeframe, EMA20, EMA50, and EMA200 are clustered tightly between $171 and $172.50. Price at $189.46 sits well above all three, forming a textbook bullish EMA stack. The regime reading here is explicitly bullish.
In contrast to the daily, the 1H MACD is far more emphatic. The line at 4.4 stands well above the signal at 1.07, producing a strongly positive histogram of 3.33. This confirms momentum alignment on the shorter timeframe.
At the same time, RSI14 on the 1H has pushed to 80.46, a clear overbought signal. Price has also broken above the upper Bollinger Band at $187.97, with the lower band far below at $150.47. That combination typically reflects strong momentum. Yet it also raises the risk of a short-term cooling-off period. The conflict between timeframes sharpens here: the daily MACD is unconfirmed, while the 1H is already stretched.
15-Minute Execution Context
The 15-minute chart shows exhaustion at the margins following the initial spike. Momentum is decelerating even though direction remains up.
On this timeframe, RSI14 has climbed to 85.67, an aggressive overbought reading. The MACD histogram has narrowed to just 0.61, with the line at 6.52 against a signal of 5.9. That narrowing suggests the immediate momentum burst may be decelerating.
Currently, price sits almost exactly on the 15-minute pivot point at $189.47. Resistance stands at $190.18 and support at $188.74. This tight range reflects consolidation rather than continuation. For short-term positioning, the easy move may already be behind intraday traders. Fresh entries likely require patience for a pullback toward the EMA20 on this timeframe, currently at $181.46.
Bullish Scenario
The bullish case for Zscaler, Inc. stock hinges on the daily EMA200 reclaim holding, backed by AI security demand and strong ARR growth.
The fundamental narrative supports this scenario. The 25% ARR growth to $3.8 billion, confirmed in the latest earnings call, provides a solid underpinning. If daily price consolidates above the pivot at $183.50, it would strengthen the bullish structure.
A push of the daily MACD histogram into positive territory would confirm the trend shift technically, not just on price alone. The next logical target would be R1 resistance at $196.29. Sector tailwinds add conviction: CrowdStrike and Palo Alto both posted double-digit gains in the same session, reinforcing the broader cybersecurity bid.
Bearish Scenario
The bearish risk centers on overbought readings across short timeframes failing to resolve constructively. A break below the daily EMA200 would invalidate the reclaim.
However, if RSI cools sharply and price falls back below the daily EMA200 at $180.59, the recent breakout would be invalidated. This would reopen the debate on whether Zscaler, Inc. stock represents a turnaround or a warning.
Furthermore, a break below the daily pivot at $183.50, followed by a test of S1 at $176.66, would suggest the gap-up was driven more by sector-wide AI security headlines than a durable trend change. The daily MACD histogram never confirmed the shift, which weakens the bullish case.
Closing Thoughts
Zscaler, Inc. stock sits at an inflection point where fundamental catalysts have collided with a technical setup that remains only partially confirmed.
Overall, AI security demand, 25% ARR growth, and a sector-wide cybersecurity bid all support the bullish argument. The daily trend is turning constructive, but its own momentum indicator has not caught up. Meanwhile, both the 1H and 15-minute timeframes show clear overbought conditions. These argue for near-term caution even within a bullish broader structure.
Given elevated ATR readings across timeframes, volatility is likely to stay elevated in the sessions ahead. Positioning should account for the possibility of consolidation or a pullback before any confirmed continuation toward higher resistance levels.
FAQ
Why did Zscaler, Inc. stock surge on this session?
Zscaler jumped 12% amid a broader cybersecurity rally triggered by AI safety warnings from frontier lab CEOs. The company’s own fundamentals reinforced the move: Q4 2026 earnings confirmed ARR reaching $3.8 billion with 25% growth, and CEO Jay Chaudhry highlighted accelerating AI security demand at Citi’s TMT Conference.
What are the key technical levels for Zscaler, Inc. stock?
The daily EMA200 at $180.59 is the critical trend-defining level. The daily pivot at $183.50 serves as near-term support, with S1 at $176.66 below. On the upside, R1 resistance sits near $196.29. A hold above the pivot favors buyers; a break below the EMA200 would invalidate the bullish structure.
Is Zscaler, Inc. stock overbought after this rally?
On the daily timeframe, RSI14 at 60.51 is constructive, not overbought. However, the 1H RSI14 has reached 80.46 and the 15-minute RSI14 sits at 85.67, both signaling overbought conditions on shorter timeframes. This suggests a near-term pullback or consolidation is possible even if the broader trend remains bullish.
Has the daily trend fully confirmed the breakout?
Not yet. While price has reclaimed the EMA200 and closed above key pivots, the daily MACD histogram remains negative at -1.24, with the MACD line at 1.76 still below the signal line at 3. A confirmed trend shift requires the MACD histogram to turn positive.
{"@context":"","@type":"FAQPage","mainEntity":[{"@type":"Question","name":"Why did Zscaler, Inc. stock surge on this session?","acceptedAnswer":{"@type":"Answer","text":"Zscaler jumped 12% amid a broader cybersecurity rally triggered by AI safety warnings from frontier lab CEOs. The company's own fundamentals reinforced the move: Q4 2026 earnings confirmed ARR reaching $3.8 billion with 25% growth, and CEO Jay Chaudhry highlighted accelerating AI security demand at Citi's TMT Conference."}},{"@type":"Question","name":"What are the key technical levels for Zscaler, Inc. stock?","acceptedAnswer":{"@type":"Answer","text":"The daily EMA200 at $180.59 is the critical trend-defining level. The daily pivot at $183.50 serves as near-term support, with S1 at $176.66 below. On the upside, R1 resistance sits near $196.29. A hold above the pivot favors buyers; a break below the EMA200 would invalidate the bullish structure."}},{"@type":"Question","name":"Is Zscaler, Inc. stock overbought after this rally?","acceptedAnswer":{"@type":"Answer","text":"On the daily timeframe, RSI14 at 60.51 is constructive, not overbought. However, the 1H RSI14 has reached 80.46 and the 15-minute RSI14 sits at 85.67, both signaling overbought conditions on shorter timeframes. This suggests a near-term pullback or consolidation is possible even if the broader trend remains bullish."}},{"@type":"Question","name":"Has the daily trend fully confirmed the breakout?","acceptedAnswer":{"@type":"Answer","text":"Not yet. While price has reclaimed the EMA200 and closed above key pivots, the daily MACD histogram remains negative at -1.24, with the MACD line at 1.76 still below the signal line at 3. A confirmed trend shift requires the MACD histogram to turn positive."}}]}
Article produced with the assistance of artificial intelligence and reviewed by the editorial team.
Disclaimer: The content of this article solely reflects the author's opinion and does not represent the platform in any capacity. This article is not intended to serve as a reference for making investment decisions.
You may also like
Corning Incorporated stock sinks below EMA200 after $2 billion equity offering
Joseph Lubin to headline Lido’s push on institutional Ethereum staking
Morgan Stanley’s spot Bitcoin ETP tops $600 million after April launch
Crypto prices
More


