
Intel stock jumps 4.7% to $101 as SK Hynix deal buzz fuels bullish trend

Intel stock surged 4.7% on reports of a potential U.S. memory chip deal with SK Hynix, closing at $101.05. The daily chart has turned constructively bullish, with the 1-hour timeframe confirming strength while the 15-minute chart digests the spike.
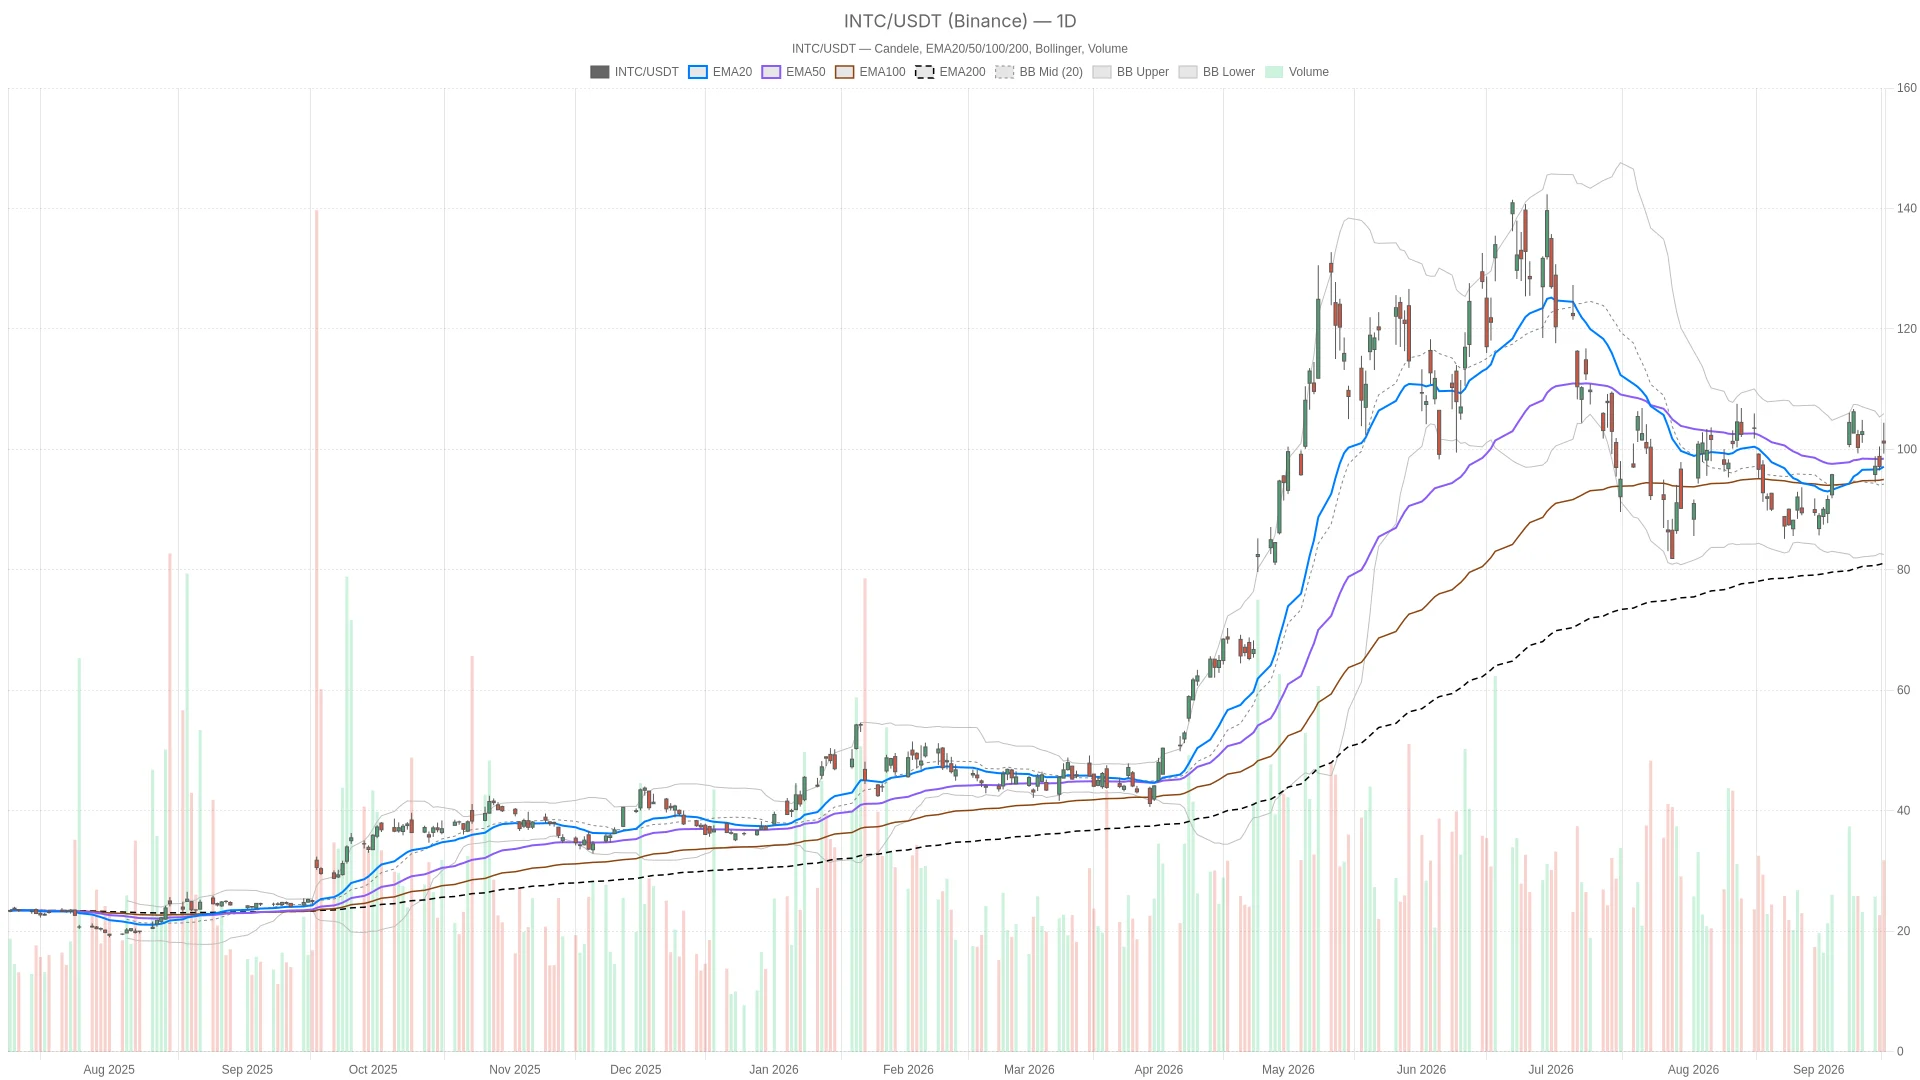 INTC — daily chart with candlesticks, EMA20/EMA50 and volume.
Summary
Key takeaways
- Intel stock jumped 4.7% to close at $101.05 on SK Hynix deal optimism, with a wide intraday range between $99.29 and $104.42.
- The daily chart shows a textbook bullish structure: INTC trades above the EMA20 ($97.12), EMA50 ($98.46), and EMA200 ($81.09).
- MACD on the daily timeframe is firmly positive, with the MACD line at 0.79 above the signal line at −0.32.
- Daily ATR14 sits at 5.23, signaling elevated volatility that calls for wider risk management.
- The 1-hour timeframe confirms the bullish bias, while the 15-minute chart reflects only a short-term consolidation pause.
Daily Chart: Intel Stock Displays a Bullish Structure
Intel stock’s daily chart exhibits a textbook bullish structure, with price closing above all major moving averages despite a neutral regime tag driven by elevated volatility.
Moving Average Alignment Signals Strength
INTC trades above its EMA20 at $97.12, EMA50 at $98.46, and EMA200 at $81.09. That stacking is a classic bullish configuration. The wide gap between the EMA200 and current price also reflects a stock that has recovered sharply from lower levels over time.
Momentum Indicators Confirm Buyer Control
RSI14 sits at 54.74 — a neutral-to-mildly-bullish reading that shows momentum without overbought stress. Meanwhile, the MACD paints a clearer picture. The MACD line at 0.79 stands above the signal line at −0.32, with a histogram of 1.11. That is a firmly positive signal consistent with buyers controlling the daily chart.
Notably, the Bollinger Bands reinforce this view. Price closed at $101.05, well above the mid-band at $94.24. It is now approaching the upper band at $105.93. The proximity suggests room to extend higher before hitting volatility-based resistance. However, further upside could also start to stretch the move.
Volatility and Pivot Context
At the same time, ATR14 stands at 5.23 — an elevated reading for Intel stock. This confirms that recent price action, including the SK Hynix-driven spike, has been unusually wide. Traders should expect larger daily swings while this volatility regime persists.
On the pivot front, the daily pivot point sits at $101.59. Resistance R1 is at $103.88, while support S1 rests at $98.75. Price closed just below the pivot. Bulls need a push through $101.59 to reassert control cleanly on this timeframe.
1-Hour Chart Confirms Intel Stock’s Bullish Bias
The 1-hour chart reinforces Intel stock’s bullish structure, with the system explicitly tagging the H1 regime as bullish — unlike the neutral daily label.
Price at $101.02 sits above the EMA20 at $100.24, the EMA50 at $99.45, and the EMA200 at $96.40. This mirrors the same bullish stacking seen on the daily chart.
RSI14 on the 1-hour timeframe reads 53.05. It is neutral but leaning constructive. Meanwhile, MACD shows the line at 0.26 above the signal at −0.07, with a histogram of 0.33. Momentum here is positive but less forceful than on the daily chart. This fits a market that has already made its big move and is now consolidating gains.
Bollinger Bands on H1 confirm this consolidation pattern. Price sits near the mid-to-upper zone. The mid-band rests at $99.24 and the upper band at $103.02. ATR14 at 1.82 indicates that intraday volatility remains active, though lower than the daily reading.
The H1 pivot point is at $100.67. Resistance R1 sits at $101.54 and support S1 at $100.16. Current price is locked in a tight range just under near-term resistance. Overall, the 1-hour chart confirms rather than contradicts the daily bullish structure.
15-Minute Chart: A Short-Term Pause, Not a Reversal
The 15-minute chart for Intel stock reflects a short-term cooling-off period, not a change in the primary bullish bias.
Price closed at $101.02, essentially in line with the EMA20 at $101.03. However, the MACD line at 0.16 has dropped below the signal line at 0.47. This produces a negative histogram of −0.30. The reading signals a short-term momentum stall rather than a trend reversal.
RSI14 at 51.18 is neutral. The Bollinger mid-band at $101.60 sits just above current price, with the lower band at $99.93. In contrast to the daily and 1-hour timeframes, the 15-minute regime is labeled neutral. This suggests the market is pausing after the SK Hynix-driven spike.
Therefore, the 15-minute weakness should be read as execution context only. It highlights a digestion phase within a broader uptrend. The primary bias across higher timeframes remains bullish.
Bullish Scenario for Intel Stock
The bullish case for Intel stock hinges on holding above the daily EMA50 at $98.46 and the H1 pivot support near $100.16.
A clean break above the daily pivot at $101.59 would be the first step. Beyond that, R1 at $103.88 becomes the next target. Clearing it would open the path toward the upper Bollinger band at $105.93.
Fundamentally, the SK Hynix deal report supports a constructive medium-term narrative. Melius Research has also called for INTC to reach $200 within two years. These catalysts add depth to the technical setup.
In addition, Seeking Alpha’s recent upgrade to a cautious buy below $100 adds a valuation argument. It frames current levels as attractive despite elevated volatility. If bullish momentum persists across the daily and 1-hour timeframes, continuation toward the upper band becomes the more likely path. A resolution of the 15-minute consolidation to the upside would confirm this scenario.
Bearish Scenario and Invalidation Points
The bearish case for Intel stock would require a rejection at daily resistance and a break back below the EMA20 at $97.12.
Specifically, a failure at R1 near $103.88 or the upper Bollinger band at $105.93 would be the first warning. A subsequent break below the daily EMA20 would shift the tone. Losing the daily S1 support at $98.75 would be an even more serious signal. It would undermine the bullish structure currently defining the daily chart.
On the 1-hour timeframe, a decisive break below the EMA50 at $99.45 would weaken the confirmation. Losing the pivot support at $100.16 would add to the concern. Meanwhile, macro context also matters. The Fed’s 25-basis-point rate hike to 3.75%–4% introduces uncertainty that could pressure risk assets broadly if sentiment shifts.
Closing Take on Intel Stock
Intel stock currently presents a bullish daily structure confirmed by 1-hour momentum, with the 15-minute chart reflecting only a short-term pause.
Volatility remains elevated. The daily ATR14 at 5.23 signals that swings in either direction can be sharp. Positioning around current levels should account for that volatility. The mixed regime signals between timeframes also warrant attention. The market continues to digest both the SK Hynix deal reports and the broader rate environment.
FAQ
What drove Intel stock higher recently?
Intel stock surged 4.7% on reports of a potential U.S. memory chip manufacturing deal with SK Hynix, closing at $101.05 within a wide intraday range of $99.29 to $104.42.
Is Intel stock’s daily trend bullish or bearish?
The daily trend structure is bullish. INTC trades above its EMA20 ($97.12), EMA50 ($98.46), and EMA200 ($81.09), with positive MACD readings confirming buyer control.
What are the key resistance levels for Intel stock?
Key resistance includes the daily pivot at $101.59, R1 at $103.88, and the upper Bollinger band at $105.93. A break above these levels would open the path toward further upside.
What would invalidate the bullish thesis on Intel stock?
A rejection at daily resistance followed by a break below the EMA20 at $97.12 and the S1 support at $98.75 would undermine the bullish structure. On the 1-hour chart, losing the EMA50 at $99.45 would also weaken the confirmation.
{"@type":"FAQPage","mainEntity":[{"@type":"Question","name":"What drove Intel stock higher recently?","acceptedAnswer":{"@type":"Answer","text":"Intel stock surged 4.7% on reports of a potential U.S. memory chip manufacturing deal with SK Hynix, closing at $101.05 within a wide intraday range of $99.29 to $104.42."}},{"@type":"Question","name":"Is Intel stock's daily trend bullish or bearish?","acceptedAnswer":{"@type":"Answer","text":"The daily trend structure is bullish. INTC trades above its EMA20 ($97.12), EMA50 ($98.46), and EMA200 ($81.09), with positive MACD readings confirming buyer control."}},{"@type":"Question","name":"What are the key resistance levels for Intel stock?","acceptedAnswer":{"@type":"Answer","text":"Key resistance includes the daily pivot at $101.59, R1 at $103.88, and the upper Bollinger band at $105.93. A break above these levels would open the path toward further upside."}},{"@type":"Question","name":"What would invalidate the bullish thesis on Intel stock?","acceptedAnswer":{"@type":"Answer","text":"A rejection at daily resistance followed by a break below the EMA20 at $97.12 and the S1 support at $98.75 would undermine the bullish structure. On the 1-hour chart, losing the EMA50 at $99.45 would also weaken the confirmation."}}]}
Article produced with the assistance of artificial intelligence and reviewed by the editorial team.
Disclaimer: The content of this article solely reflects the author's opinion and does not represent the platform in any capacity. This article is not intended to serve as a reference for making investment decisions.
You may also like
Fed Rate Hike Adds More Pressure as U.S. Mortgage Rates Rise for Four Consecutive Weeks, Approaching 7%, Housing Market Recovery May Be Further Delayed
Freddie Mac reported on Thursday that as of September 17, the average 30-year fixed mortgage rate in the United States rose to 6.95%, up from 6.76% the previous week. This marks the fourth consecutive weekly increase and the highest level since January 2025.
Overnight U.S. Stocks | U.S. Weekly Initial Jobless Claims Unexpectedly Decline, Three Major Indexes Close Higher, Intel (INTC.US) Surges Over 7.6%
At the close, the Dow Jones index rose by 316.14 points, or 0.61%, to 51,778.04 points; the S&P 500 index gained 85.91 points, or 1.14%, to 7,637.72 points; and the Nasdaq Composite index increased by 439.87 points, or 1.69%, to 26,418.30 points.
Bitcoin’s October rally meets 6% yield fears – Which side wins Q4?
Bank of Japan is expected to deliver a hawkish hike, pressured by rising inflation
Crypto prices
More


