
BANK Price Faces Breakout Test After Reported 96.5% Collapse

- BANK price trades near $0.034 in the supplied snapshot, with RSI at a neutral 48.52.
- Crypto Patel reports a 96.5% decline from approximately $0.6957 to $0.0243 over 41 days.
- Franklin identifies a four-hour close above $0.0351 as a condition for targeting $0.0425.
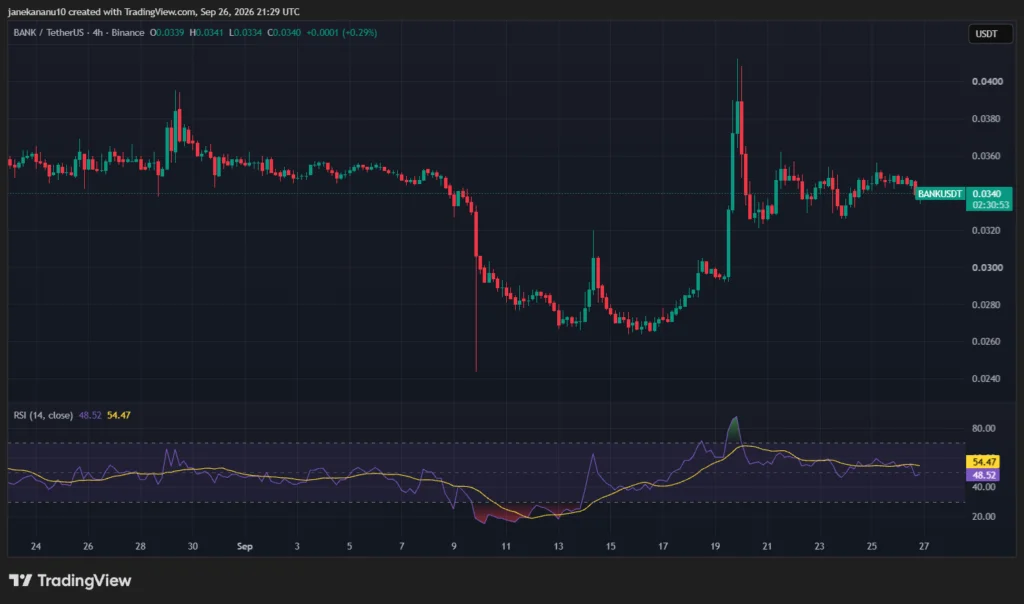
BANK price trades near $0.0340, up 0.29% in the supplied market snapshot, following sharp swings on the four-hour timeframe. Momentum shows no clear direction, with RSI at 48.52.
Separately, analyst Crypto Patel reports a 96.5% decline from the token’s cited record high. Franklin outlines a potential recovery setup, conditional on a close above a nearby technical level.
BANK Price Recovers From Lows After Steep Token Drawdown
Crypto Patel places the decline between approximately $0.6957 and $0.0243 over 41 days. Those figures imply a loss of roughly 96.5%, consistent with his calculation.
A hypothetical $1,000 purchase at the cited peak would have fallen to about $35 at that low. This example excludes trading fees and assumes the investor held throughout the decline.
The supplied $0.0340 snapshot represents a different price point from Patel’s $0.0243 observation. At $0.0340, BANK price stands approximately 40% above that cited low, while still trading roughly 95.1% below $0.6957.
The provided technical summary also describes a rapid rebound after a dip toward $0.0240. That recovery shows buying at lower prices but does not establish a lasting reversal.
BANK Price Setup Depends on Four-Hour Breakout Confirmation
His next target sits near $0.0425. Reaching that level from $0.0351 would represent approximately 21.1% upside, although the setup still requires confirmation.
The supplied BANK technical analysis identifies a broader hurdle between $0.0350 and $0.0360. A break above that band could bring $0.0400 into view before Franklin’s higher target.
RSI at 48.52 provides no clear bullish or bearish signal. With the indicator near its midpoint, price has yet to establish a directional advantage.
Support sits near $0.0320 following the pullback from approximately $0.0410. A break below that floor could expose the next level around $0.0280.
Disclaimer: The content of this article solely reflects the author's opinion and does not represent the platform in any capacity. This article is not intended to serve as a reference for making investment decisions.
You may also like
The 10-year US Treasury yield hits its highest level since 2002! Oil prices return to $100, triggering a global bond sell-off, and the 30-year UK government bond rate breaks 6% for the first time
The yield on US benchmark Treasury bonds has reached its highest level since 2002 as bonds face heavy sell-off.
Markets reduce bets on European Central Bank rate hikes

EPF lifts Sunway Healthcare stake to 8.022% after share acquisitions
Ecopetrol names Mónica Jiménez González legal affairs chief, general secretary
Crypto prices
More


