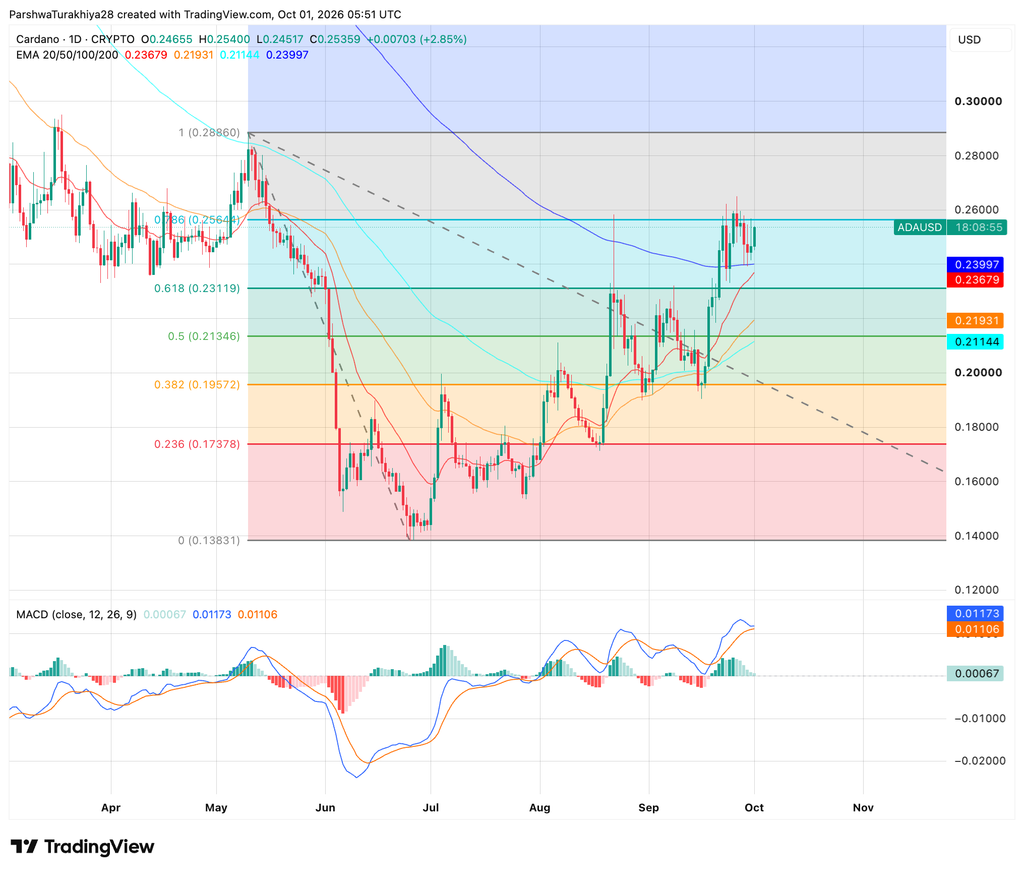
The pullback that followed stopped at about $0.24, right at the 200-day EMA of $0.23997, with the 20-day EMA at $0.23679 just beneath it.
Related: Bitcoin Price Prediction October 2026: BTC Eyes $90,000 in October as Fed Hike Odds Slide Below 50%
MACD still sits above its signal line, 0.01173 against 0.01106, but the gap has narrowed to 0.00067, so the momentum behind the September push has cooled. A daily close above $0.2564 would put the $0.2886 May high back in view.
$ADA Support and Resistance Levels, October 2026
$ADA News: Whales Sell and Open Interest Falls as Analyst Flags a Sell Signal
Ali Charts, citing Santiment data, said large holders have sold about 90 million $ADA, worth roughly $22.5 million, since September 20. Futures open interest fell 9% over the past week, from $1.99 billion to $1.81 billion, which means traders are closing leveraged bets rather than opening new ones.
He linked the weaker demand to a Tom DeMark Sequential sell signal on the daily chart on September 26 and said $ADA fell 10% afterward. His parallel channel puts mid-range support at $0.24, with $0.21 below it and the channel top near $0.28.
$ADA News: LuckSide Crypto Flags a Golden Cross
LuckSide Crypto said $ADA is confirming its first golden cross since August 2025, with the 50-day average sitting on the 200-day, and that earlier crosses were followed by higher prices, sometimes after a short-term dip.
Related: Ethereum Price Prediction October 2026: ETH Targets $3,000 in October as Short Positions Stack Up
He called it no guarantee and pointed to Token2049 on October 7 and 8 as a stage for Ouroboros Leios updates. The exponential averages on the chart above still show the 50-day at $0.2193 below the 200-day at $0.2400, so the cross he describes does not appear on that setting.
$ADA News: Cardano Foundation and Petrobras Put Fuel Data on Cardano
The Cardano Foundation announced on September 30 two blockchain applications built with Petrobras, one tracking sustainable aviation fuel claims and one tracking the lifecycle of its renewable diesel, Diesel R.
The aviation project uses Cardano to show that each environmental benefit is claimed only once, while the diesel model records data across production, transport and use for emissions reporting. The release is the Foundation’s own, covers R&D projects rather than a commercial rollout, and says nothing about demand for $ADA.
Cardano Price Prediction for October 2026: Week-by-Week Outlook
Cardano Price Prediction: Bullish and Bearish Scenarios for October
Bullish Case, Target: $0.2886
$ADA holds the 200-day EMA at $0.2400 and closes a day above the 0.786 Fibonacci level at $0.2564. That opens the channel top near $0.28 that Ali Charts marks, then the $0.2886 May high, provided whale selling eases and open interest stops falling.
Bearish Case, Risk Level: $0.2134 (0.5 Fibonacci)
$ADA loses $0.2400 and the 0.618 Fibonacci level at $0.2312, which would match Ali Charts’ call for a move to the channel’s lower boundary near $0.21. A daily close below $0.2134 would expose the 0.382 Fibonacci level at $0.1957.
Related: $XRP Price Prediction October 2026: $XRP Eyes $1.70 in October as Its Triangle Nears a Breakout
Cardano Price Prediction FAQs
What is the Cardano price prediction for October 2026?
$ADA could extend toward $0.2886 in October if it holds above $0.24 and clears the 0.786 Fibonacci level at $0.2564. Losing $0.24 risks a slide toward $0.2134.
Will Cardano reach $0.30 or $1 in October?
$0.30 would need a gain of about 18% from $0.2536 and a clean break of the $0.2886 May high. Whale selling and falling open interest do not favor a quick move. $1 would need about 294%, and nothing on the chart supports it, since the highest level in view is the May high.
Could Cardano fall below $0.20 in October?
Yes, if it loses $0.24 and the 0.5 Fibonacci level at $0.2134. That is a drop of about 21%, and the 0.382 Fibonacci level at $0.1957 sits just above it. Ali Charts’ plan is to watch $0.24 first, then $0.21.
Has Cardano formed a golden cross?
LuckSide Crypto says $ADA is confirming its first golden cross since August 2025, but he called it no guarantee. The exponential averages on the TradingView chart still show the 50-day at $0.2193 below the 200-day at $0.2400, so the signal depends on which averages are used.


 coinedition.com
 Cardano Price Analysis (Source: TradingView)