- PEPE is close to support after a few times coming back down, with the three day chart showing down resistance to limit recoveries.
- The three-day structure shows lower highs beneath resistance, while horizontal support absorbs repeated selling pressure from sellers.
- The price has been squeezed between an overhead resistance and a defended lower limit, signifying recent volatility.
PEPE is stuck between the downward trendline and the horizontal support, with the latest price action witnessing several price reversals as the three-day timeframe continues to shrink in the chart.
Descending Resistance Controls Recovery Attempts
The three-day chart exhibits multiple lower tops below a falling green trendline. That pattern has held true in the larger corrective pattern.
The green line, which has been making higher highs, is still in a downtrend. Each recovery has encountered sellers before reaching previous swing levels. This keeps the broader sequence tilted toward lower highs.
A shorter white trendline creates another resistance layer above recent price action. Several rebounds have approached this barrier before turning lower. The overlapping resistance lines keep upside attempts within a confined area.
The dashed lines eventually merge at the right side of the graph. This creates a narrowing structure as available price space continues shrinking. Recent consolidation therefore looks tighter than earlier movements.
Support Absorbs Repeated Selling Pressure
The horizontal support zone has repeatedly attracted buyers during recent declines. Price has approached this area several times without sustaining a breakdown. That repeated reaction keeps the lower boundary central to the chart.
The candles in recent times are moving around the support area with lesser amount. The earlier periods had greater directional changes and larger swings.The latest consolidation instead reflects more restrained trading near established lows.
The chart also places current price far below earlier cycle highs. That distance illustrates the scale of the preceding corrective movement. Current action therefore reflects an attempt to stabilize after prolonged weakness.
Volume has also varied considerably across the displayed period. Earlier spikes accompanied stronger directional movements and larger price swings. More recent bars appear smaller alongside the narrower consolidation.
Current Price Sits Near the Lower Trading Range
The latest chart shows PEPE around $0.0000040315, down 2.51% over 24 hours. Price remains near the lower portion of the displayed daily range. The session has included several sharp reversals around nearby levels.
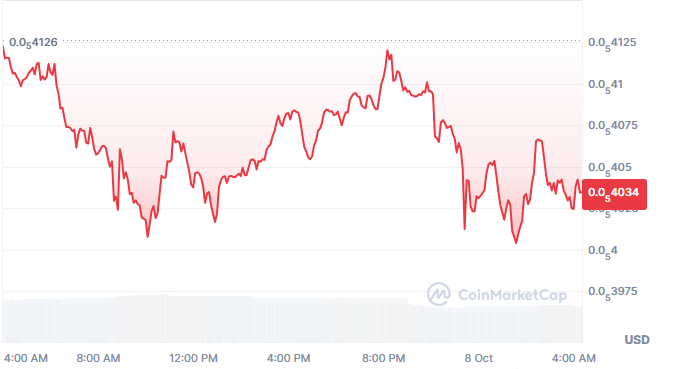
During the displayed period, price initially declined from approximately $0.00000414. It later approached the $0.00000400 region before recovering. Subsequent rebounds reached the $0.00000410 area before facing renewed selling.
The strongest recovery approached approximately $0.000004125 during the evening session. However, that advance was followed by another sharp decline. Price subsequently recovered again before settling near the latest displayed level.
About $1.66 billion in capitalization is indicated by market data on top of the chart. The 24-hour volume reported is nearly $185.9 million. The displayed volume-to-market-capitalization ratio is approximately 11.13%.
The supply data shows approximately 413.77 trillion tokens circulating. The same figure appears as the maximum supply on the displayed data. The holder count stands near 616,480 addresses.