
ASML Holding stock closes above daily averages but below hourly resistance

ASML Holding stock retains a bullish daily bias, but the hourly chart does not confirm it. The completed session ended above all three daily exponential averages, while shorter-term price positioning remains less supportive. The central question is whether daily support can hold while price clears the overhead hourly averages.
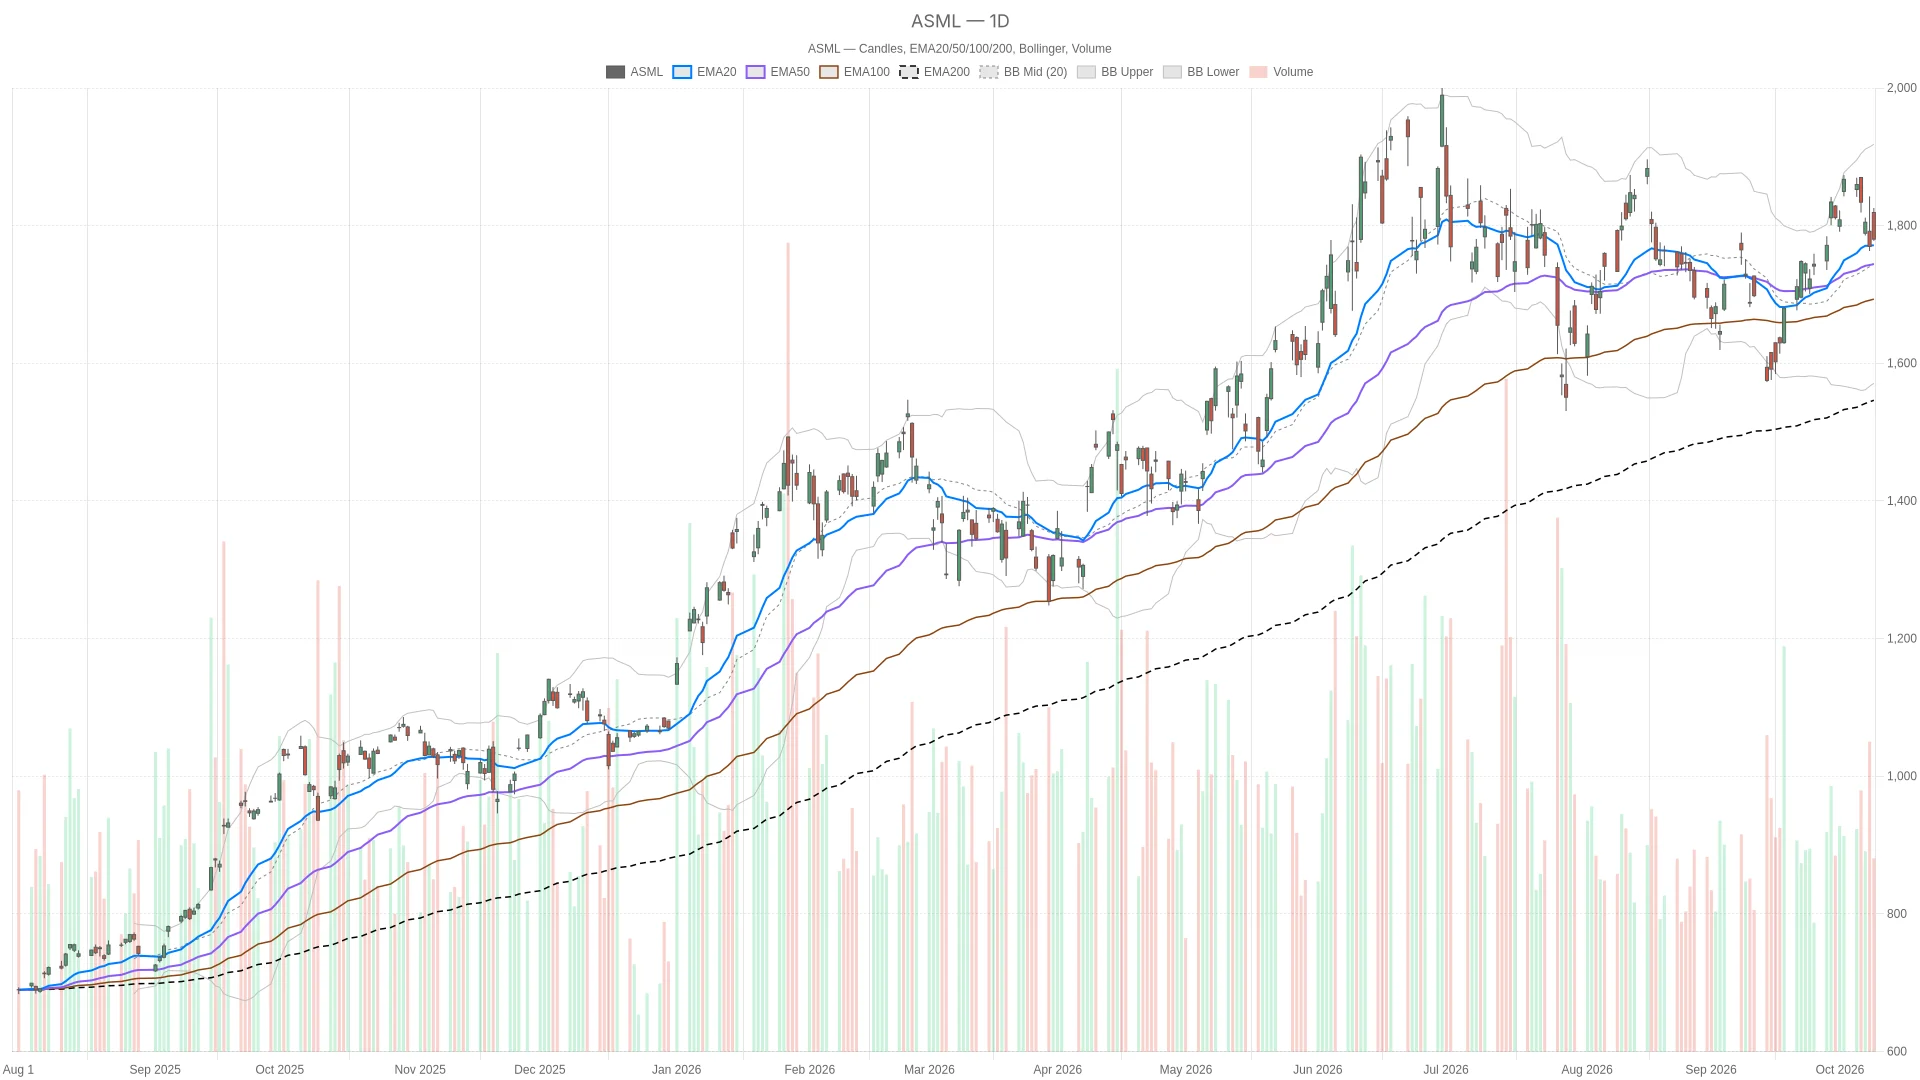 ASML — daily chart with candlesticks, EMA20/EMA50 and volume.
Summary
Key takeaways
- ASML closed at $1780.34 on Friday, October 9, 2026, above the daily 20-session EMA ($1771.59), 50-session EMA ($1744.24), and 200-session EMA ($1549.15).
- Daily RSI14 is 52.44, above neutral; the MACD histogram is 2.67, down from 6.37 on October 8.
- Hourly RSI14 is 42.41, below neutral 50, with a negative MACD histogram of -0.24.
- The close sits below the next-session daily pivot ($1794.64) and below the hourly 20-hour EMA ($1795.45) and 50-hour EMA ($1803.73).
- Daily ATR14 is $51.83; daily first resistance is $1811.27 and daily first support is $1763.70.
On Friday, October 9, 2026, ASML opened at $1819.14, traded between a low of $1778.00 and a high of $1825.57, and closed at $1780.34, against a previous close of $1769.79. The session gained 0.6% versus the previous close, despite ending below its opening price. Prices and technical indicators are from Twelve Data.
ASML Holding stock retains its daily bullish structure
The close stands above the 20-session EMA at $1771.59, the 50-session EMA at $1744.24, and the 200-session EMA at $1549.15. Price and these averages are bullishly aligned. The close sits above the session low of $1778 and above the 20-session average at $1771.59, making that area important to the bullish case.
Meanwhile, daily RSI14 stands at 52.44, above neutral but below overbought territory. The MACD line at 26.47 is above its signal at 23.81, with a positive histogram of 2.67. However, the histogram declined to 2.67 from 6.37 on October 8. The daily momentum evidence therefore remains positive, but it is not uniformly supportive.
The daily Bollinger midpoint is $1744.55, below the close, with the upper band at $1918.16 and the lower band at $1570.94. Price is above the midpoint without reaching the upper band. Daily ATR14 reads $51.83, providing a volatility reference rather than a directional signal. When trading resumes, the daily pivot for the next session is $1794.64, with first resistance at $1811.27 and first support at $1763.70.
Hourly weakness complicates the daily view
In contrast, the session close sits below the hourly 20-hour EMA at $1795.45 and 50-hour EMA at $1803.73. It remains above the 200-hour EMA at $1770.71. Hourly RSI14 is 42.41, below neutral, while the MACD line at -12.19 sits below its signal at -11.95. The histogram of -0.24 confirms that negative line-to-signal relationship.
The close also sits below the hourly Bollinger midpoint at $1794.32, but above the lower band at $1756.62. The upper band is $1832.02. Together, these levels place the close in the lower half of the hourly envelope. The hourly pivot for the next session is $1781.81, with first resistance at $1785.63 and first support at $1777.63.
15-minute chart adds execution context
For execution context, the 15-minute chart has a bearish alignment. The close is below the 20-period EMA at $1783.68, the 50-period EMA at $1790.95, and the 200-period EMA at $1802.76. RSI14 is 44.69, below neutral. Nevertheless, the MACD line at -2.36 is above its signal at -2.79, producing a positive histogram of 0.43. That local positive reading does not override the daily-hourly conflict. The 15-minute pivot for the next session is $1780.93, with first resistance at $1783.86 and first support at $1778.51.
Earnings coverage frames the uncertainty around ASML
Meanwhile, Yahoo Finance coverage published during Friday’s session highlighted AI-driven demand and strategic partnerships alongside premium valuation and policy risks. A Seeking Alpha earnings preview published during the session argued that high expectations may be justified, citing memory demand and leading-edge logic spending. These are editorial assessments, not confirmation from the chart.
A Yahoo Finance report published after Friday’s close pointed to the October 14 earnings report and questioned ASML’s valuation. Its publication belongs after the completed session and should not be treated as an explanation for that session’s price action.
Bullish and bearish scenarios for ASML Holding stock
The bullish case requires ASML Holding stock to hold the daily 20-session EMA at $1771.59. Clearing the next-session daily pivot at $1794.64 would strengthen that case. Above it, the hourly averages at $1795.45 and $1803.73 form further hurdles before daily first resistance at $1811.27. Acceptance above those levels would provide the hourly confirmation currently missing.
Conversely, a break below the daily 20-session EMA at $1771.59 would weaken the bullish case. The hourly 200-hour EMA at $1770.71 comes next, followed by daily first support at $1763.70. A sustained break beneath that support would invalidate the near-term bullish scenario. The daily Bollinger midpoint at $1744.55 and 50-session EMA at $1744.24 would then become the next lower reference levels.
Overall, ASML stands above daily trend support but below the next-session daily pivot and key hourly averages. Daily ATR14 of $51.83 keeps volatility relevant to those boundaries. The unresolved issue is whether hourly resistance can be cleared without sacrificing the daily support structure.
FAQ
Where did ASML close on Friday, October 9?
ASML closed at $1780.34, gaining 0.6% from the previous close. The session ranged between a low of $1778 and a high of $1825.57.
What does the daily chart show for ASML Holding stock?
The close stands above the 20-session EMA ($1771.59), 50-session EMA ($1744.24), and 200-session EMA ($1549.15). Daily RSI14 is 52.44, above neutral, and the MACD line is above its signal with a positive histogram of 2.67.
What are the key support and resistance levels?
Daily first support is $1763.70, with the daily 20-session EMA at $1771.59 and the hourly 200-hour EMA at $1770.71 nearby. Daily first resistance is $1811.27, with the next-session daily pivot at $1794.64 and hourly averages at $1795.45 and $1803.73 forming intermediate hurdles.
What does the hourly chart indicate?
The close is below the 20-hour EMA ($1795.45) and 50-hour EMA ($1803.73) but above the 200-hour EMA ($1770.71). Hourly RSI14 is 42.41, below neutral, and the hourly MACD histogram is negative at -0.24.
Article produced with the assistance of artificial intelligence and reviewed by the editorial team.
Disclaimer: The content of this article solely reflects the author's opinion and does not represent the platform in any capacity. This article is not intended to serve as a reference for making investment decisions.
You may also like
American Express stock closes at $308.17 below all three daily EMAs
The Next Altcoin Dip Could Catch Traders Off Guard: 5 Coins Worth Watching Before Momentum Returns
One Macro Breakout Could Change the Altcoin Market: Are These 5 Cryptos Worth Holding Before the Next Rally?
Top 3 Cheapest Crypto Coins to Invest in — PEPE, VET, BONK

Crypto prices
More


