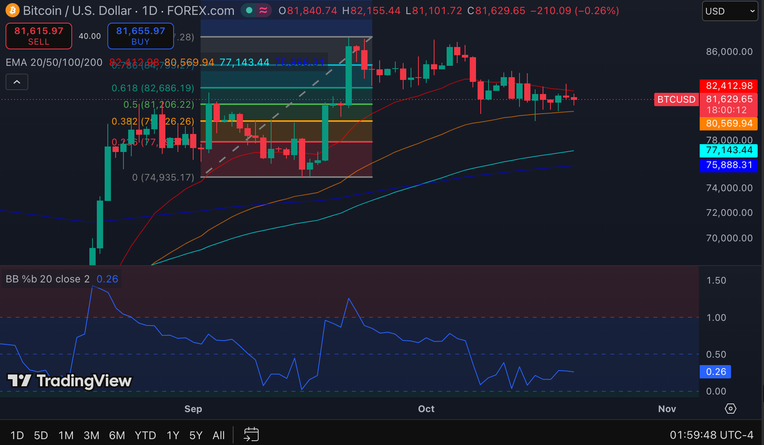
This positioning suggests Bitcoin’s broader recovery structure remains intact despite recent losses. However, the price must reclaim $82,413-82,686 to restore confidence in its immediate outlook.
A successful breakout could bring $85,000 into focus, followed by resistance near $86,000. Besides, stronger buying activity could help $BTC challenge these barriers after its recent retreat.
Bitcoin Price Dynamics (Source: TradingView)
The Bollinger Bands %B indicator stands at 0.26, placing Bitcoin closer to the lower end of its recent trading range. Consequently, selling pressure remains significant, although buyers could attempt a rebound near support.
Related: Meme Coins Price Prediction: Dogecoin (DOGE), Shiba Inu (SHIB), and MemeCore (M)
Conversely, a drop below $80,570 would expose $79,726 and potentially $77,143. Hence, Bitcoin’s ability to defend its 50-day EMA remains crucial.
Ethereum Price Prediction: $ETH Bulls Must Reclaim $2,492
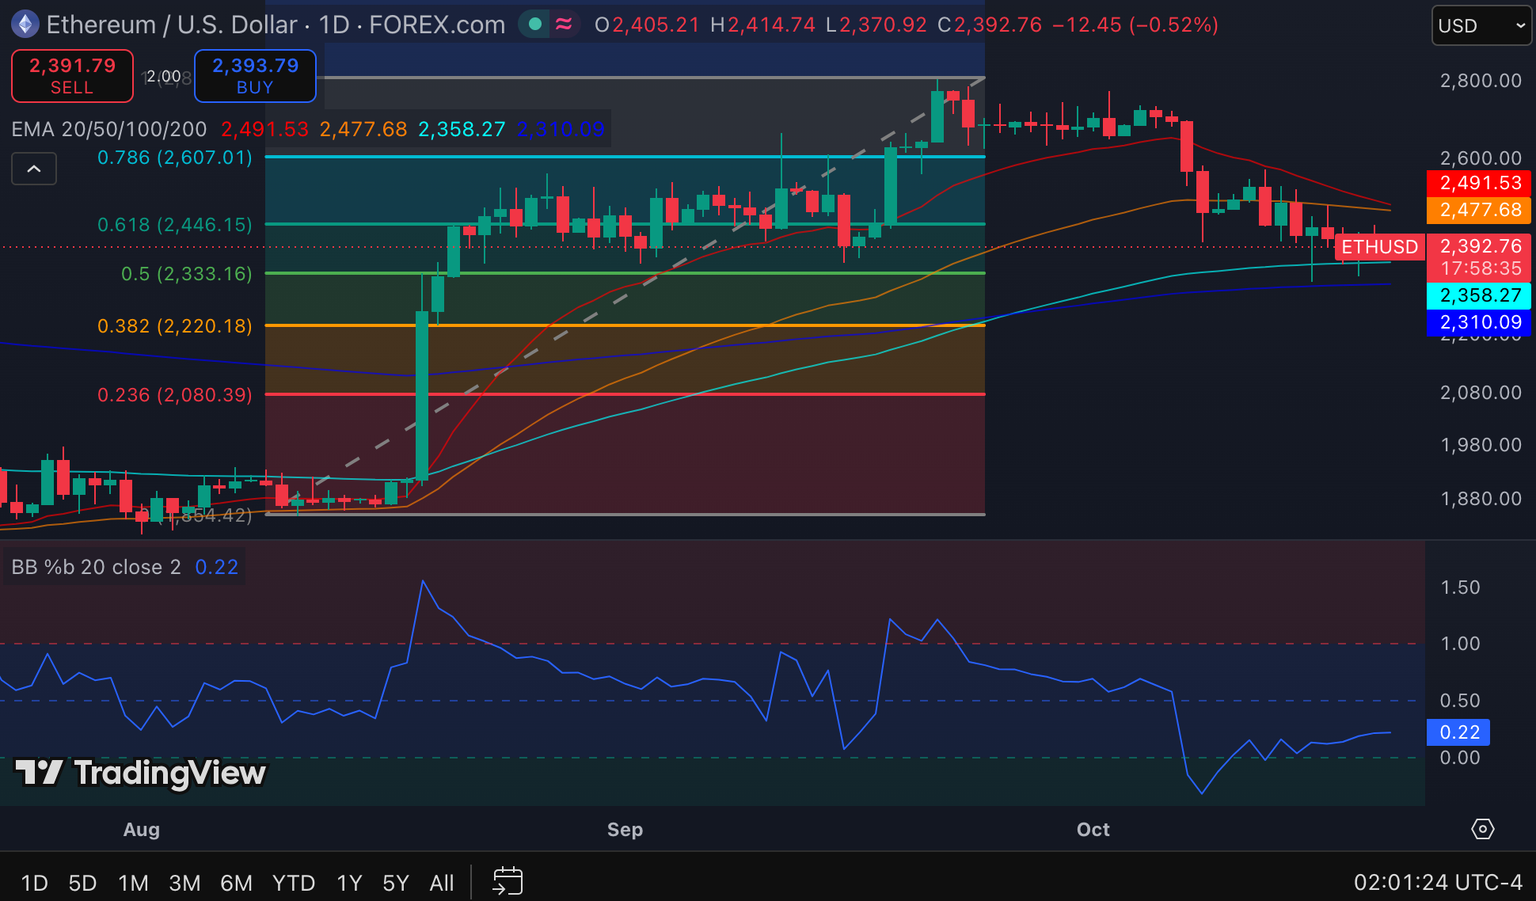
Ethereum trades around $2,392.76 after retreating from the $2,800 resistance region. The decline below its 20-day EMA at $2,491.53 and 50-day EMA at $2,477.68 signals deteriorating short-term momentum.
However, $ETH remains above its 100-day EMA at $2,358.27 and 200-day EMA at $2,310.09. These averages provide important reference points for assessing whether the broader recovery can survive.
Ethereum Price Dynamics (Source: TradingView)
The immediate support zone sits between $2,333 and $2,358. A breakdown below this range could expose $2,310, followed by $2,220. Moreover, a deeper correction could bring $2,080 into view.
The Bollinger Bands %B indicator stands at 0.22, reflecting continued weakness near the lower volatility band. Nevertheless, $ETH could regain momentum if buyers push the price above $2,446.
Related: Worldcoin Price Prediction: WLD Presses Triangle Resistance as World ID Targets Banks
A sustained move beyond $2,492 would strengthen the recovery case and potentially open the path toward $2,607. For now, Ethereum needs stronger demand to overcome nearby resistance.
$XRP Price Prediction: $1.285 Support Faces Pressure
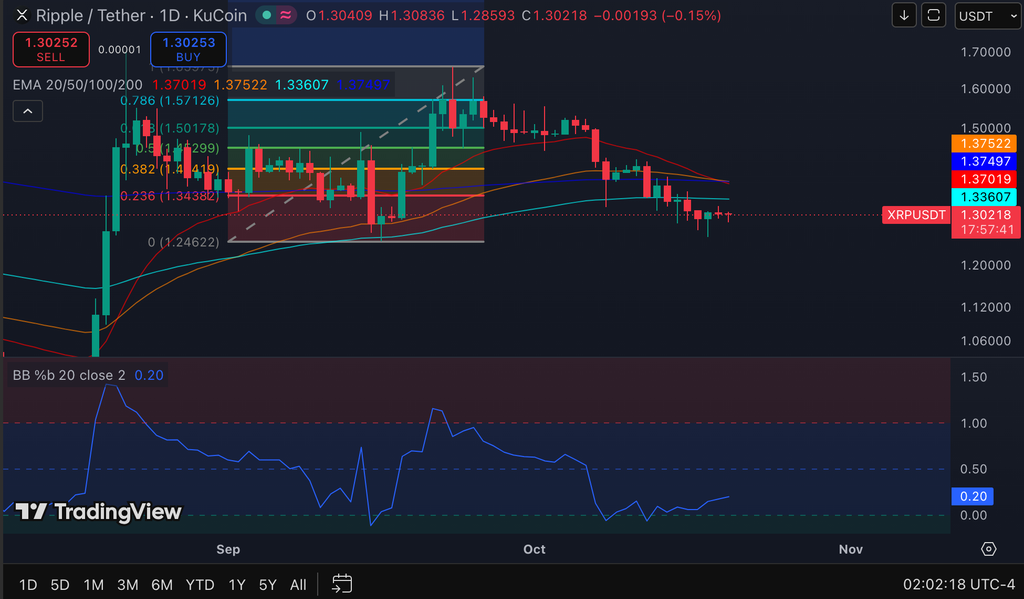
$XRP trades near $1.30218 following a retreat from the $1.60 region. Its sequence of lower highs and lower lows indicates that sellers continue to control the short-term trend.
Significantly, $XRP trades below its 20-day, 50-day, 100-day, and 200-day EMAs. This alignment presents a more challenging recovery setup than Bitcoin’s current structure.
 $XRP
Price Dynamics (Source: TradingView)
The immediate support zone spans $1.285-1.300. If sellers push $XRP below this area, the price could revisit $1.246 and potentially $1.20.
However, a rebound above $1.336 would offer an initial improvement. $XRP would then need to overcome the $1.370-1.375 resistance cluster to strengthen its recovery prospects.
Additionally, the Bollinger Bands %B indicator stands at 0.20, signaling persistent downside pressure. A sustained move above $1.375 could eventually open the way toward $1.42 and $1.47.


 coinedition.com