Liying Crypto Talk: 10.22 Latest Market Analysis for Bitcoin (BTC) and Ethereum (ETH)
Everyone! Although Bitcoin's price has rebounded to 84,500, there is still obvious selling pressure above. Many experienced traders may get confused at this stage, thinking it’s a reversal and wanting to chase highs, or thinking it’s hopeless and wanting to sell at a loss. Actually, this is the time to test your mindset most. Technical indicators are currently giving rather subtle signals. Looking at the moving averages first, the price is above all key moving averages, which is a positive sign. However, the MACD indicator shows DIF and DEA operating above the zero axis, indicating that bullish momentum is not strong enough and this is only a mild rebound. As for the Bollinger Bands, the price is currently running between the middle band (82,627) and the upper band (84,234), and has even breached the upper band, which usually means a short-term overbought situation, with a need to pull back to the middle band to confirm support. Overall, the technical outlook is bullish, but be wary of the risk of a pullback after hitting new highs.
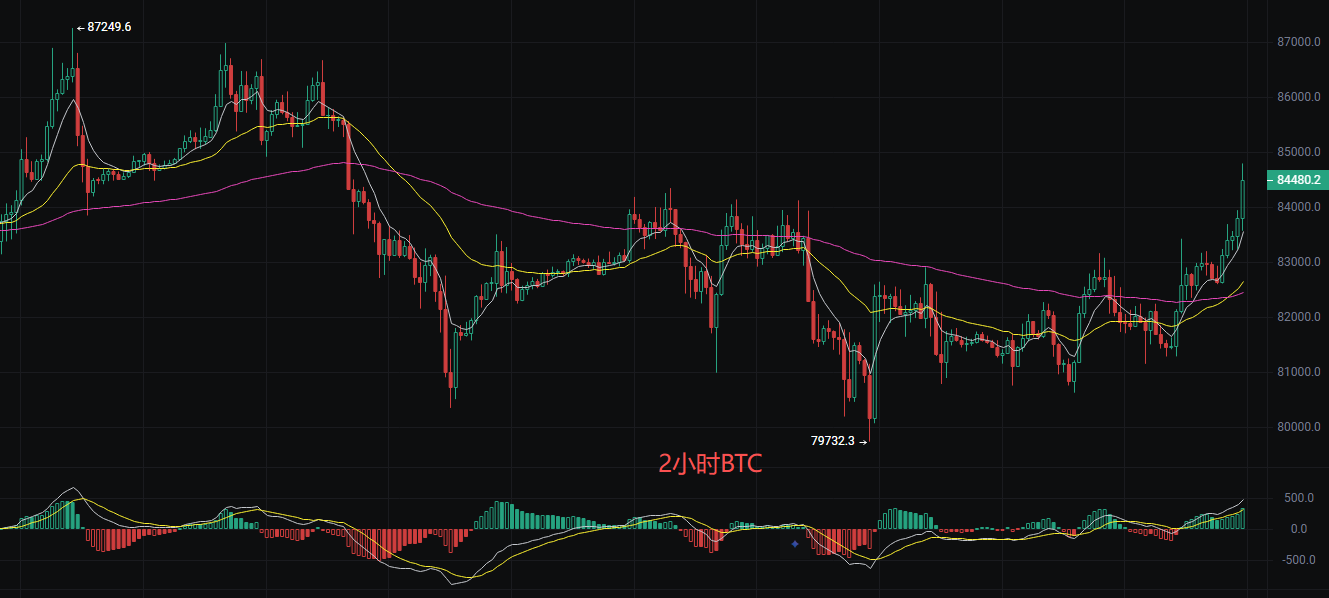
Based on the current slightly bullish consolidation, here is a cautious trading strategy:
Long strategy:
It is recommended to wait for a pullback to stabilize in the 83,600-83,800 range before entering.
Stop loss: Below 82,400
Target: First target 86,000, if broken look for 87,000
Short strategy:
Wait for a rebound to the resistance area of 85,000-85,500, and enter when there is a long upper shadow or bearish engulfing signal
Stop loss: Above 86,200
Target: Looking back to around 83,000
Core principle: Rather miss an opportunity than make a wrong move, always set your stop loss strictly
Ethereum
Everyone, Ethereum’s current price is 2,510. What does this mean? It means bears can no longer push it down, and bulls are starting a tentative counterattack. The 2,500 level is very crucial; it is both a psychological barrier and a previous high-volume trading area. Managing to hold above it is a victory. Market sentiment is now shifting from panic to wait-and-see, even with some slight anticipation. As long as it doesn’t drop below 2,450, the short-term trend remains bullish. Technical indicators are comprehensively improving; after a golden cross under the zero axis on the MACD, volume continues to expand, and the DIF and DEA lines are diverging upward, indicating bullish momentum is building. The middle band of the Bollinger Bands has turned from declining to flat, and the price is stable above the middle band and touching the upper band, suggesting volatility is shrinking and a directional breakout is imminent. Overall, the technical side has signaled a bottom reversal, but beware of false breakouts. It’s recommended to wait for a pullback confirmation before adding more positions.
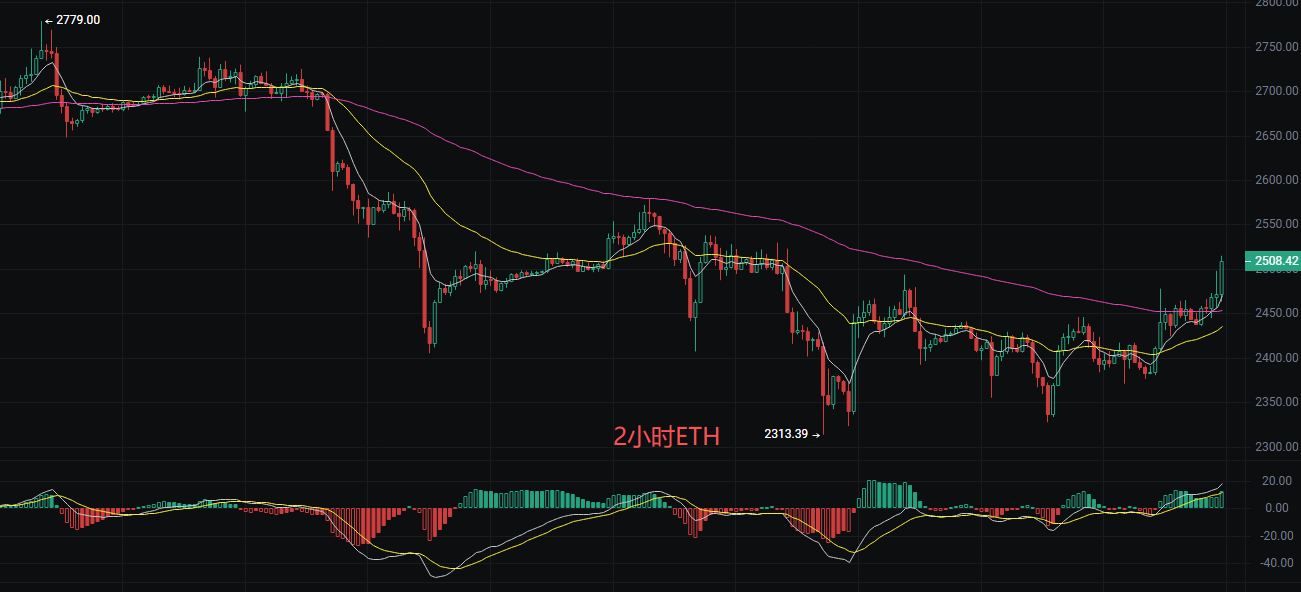
Long: Enter in batches at 2,480-2,490, stop loss at 2,440
Short: Try short around 2,550-2,560 if resistance holds, stop loss at 2,600
Position size: ≤10%, keep enough capital
Discipline: Don’t overtrade, don’t hold losing positions, follow the trend
The above content is exclusively original by Liying. Please indicate the source if reprinting! There is a delay in article review, and market conditions change rapidly. The above suggestions are for reference only; act at your own risk.