Li Ying Chat Coins: 10.25 Latest Market Analysis of Bitcoin (BTC) and Ethereum (ETH)
Family! Bitcoin is currently priced at 79,600. Right now, it's like a deflated ball, steadily dropping. Just look at those moving averages — they're like mountains pressing down, especially the long-term purple moving average, with the price consistently running below it. What does this mean? It means the main trend is still controlled by the bears, and for the bulls to turn things around, it won't be easy. The current candlesticks are weak and soft, rebounds lack volume, and it feels like the main players are gradually selling off or shaking out holders. Technical indicators show a classic bearish alignment among the moving averages; the MACD indicators, with both DIF and DEA lines diverging downward below the zero axis, and the price has already touched the lower band at 79,799. Although in theory, there's support here, the Bollinger Bands are opening downwards, which usually signals the start of a one-sided decline, not a reversal. Overall, indicators jointly signal a bearish bias: any rebound becomes selling pressure.
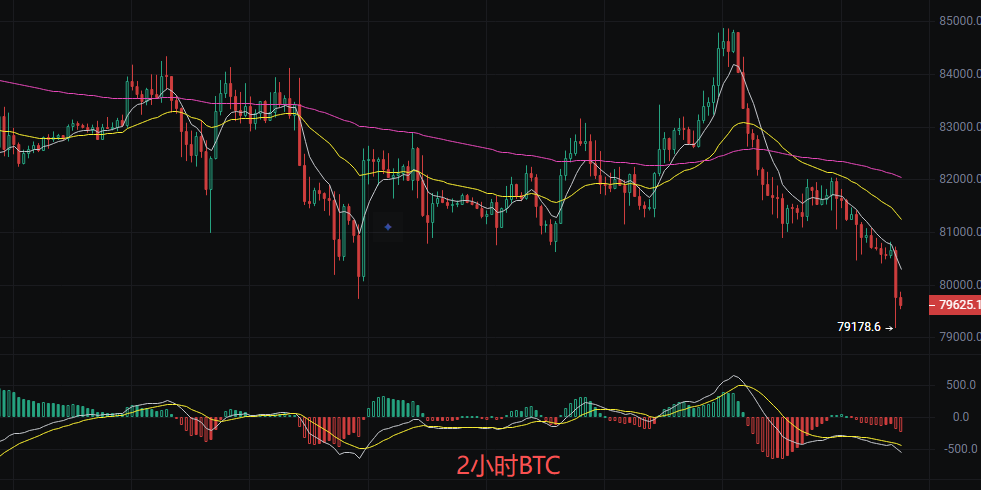
At present, the market is weak. It is recommended to prioritize short positions and supplement with long positions on dips.
Short strategy: Conservative traders wait for a rebound to 80,290-80,500 and see if it's blocked before entering. Set the stop loss above 81,000, target 78,500, and if broken, look for 77,800.
Long strategy: Avoid opening heavy longs unless the price stabilizes above 80,500. For ultra-short-term rebound trades, wait for a long lower shadow to appear between 78,000-78,200, set stop loss below 77,500, and target 80,000. For counter-trend positions, be quick in and out.
Ethereum
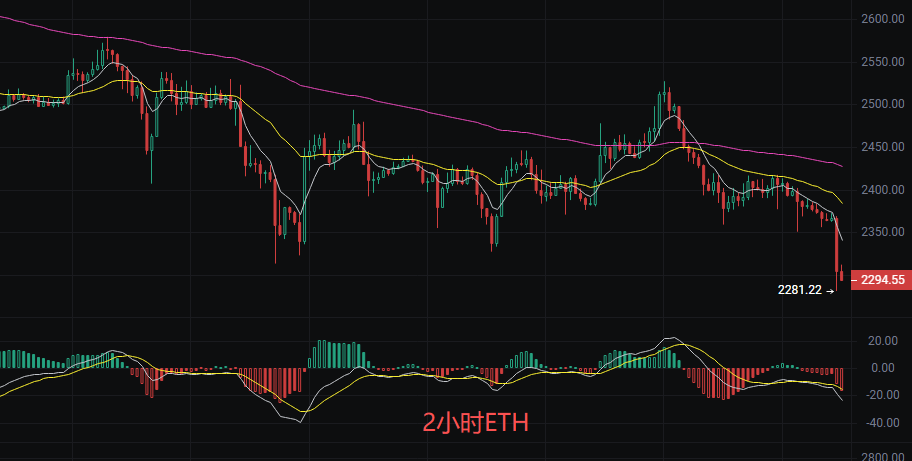
Family, Ethereum's current price is 2,300. Let’s look at the chart: the price is hovering around 2,300, like a swing at the edge of a cliff — quite unsettling. Since the end of September, it’s been a downward slope. Although there have been a few noteworthy rebounds trying to push higher, each attempt was harshly pushed back down, which means the selling pressure above is truly heavy. The candlestick has now dropped near the recent local lows again. Many may be asking: Is this about to collapse to 2,200, or can we catch a bottom around 2,300? In fact, the current market is a classic weak consolidation; bulls lack strength; bears aren’t hurrying to crash the price either, and everyone is waiting for a clear direction. At this time, don’t blindly try to catch the bottom or chase the rally. Stay calm, assess clearly, and act only after you understand the situation. Overall, indicators show an "oversold but not yet stabilized" status.
Strategy for Bulls and Bears
The current trend is bearish. Prioritize short positions and supplement with short-term longs.
Shorts: Wait for a rebound to 2,380-2,400 before entering. Stop loss set at 2,435. Target the previous low at 2,300, if broken, look for 2,250.
Longs: Aggressive traders can try light short-term longs at the current price of 2,300-2,310. Strict stop loss at 2,275. Target 2,360-2,380, and exit promptly. Do not linger in the trade.