Bitcoin’s price experienced a significant drop yesterday following the breakdown of the $64K support level. The price is now in a key area that could determine the crypto market’s mid-term fate.
Technical Analysis
By TradingRage
The Daily Chart
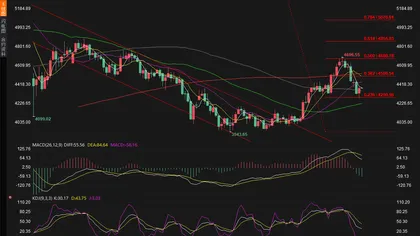
On the daily chart, the price has been dropping since creating a double top pattern at the $68K resistance level. The $64K level has also been broken down to the downside, and the cryptocurrency is testing the 200-day moving average.
If it also fails to hold the price, the market is likely to go through a much deeper decline toward $52K. With the RSI also showing values below 50%, the momentum is pointing to a potential continuation of the bearish move.
The 4-Hour Chart
Looking at the 4-hour chart, things seem a bit more optimistic for Bitcoin. The price has rebounded from the $60K support level with a long wick and is currently trading around inside the range between $64K and $60K.
Meanwhile, a retest of the $60K support zone is very probable, as both the momentum and market structure are hinting at this scenario. Whether the $60K level holds or breaks will likely determine the price trend in the coming months.
On-Chain Analysis
By TradingRage
Bitcoin Short-Term Holder SOPR
With Bitcoin again failing to create a new record high, analyzing investors’ behavior can provide clues for better predictions of future price action.
This chart demonstrates the short-term holder SOPR, an on-chain metric that measures the ratio of profits/losses realized by short-term Bitcoin holders. Values above one show profit realization, while values below 1 indicate realizing losses.
As the chart displays, the STH SOPR metric has recently recovered above 1, as the market has rebounded from the $55K level.
However, following the recent drop, the STH SOPR is once again declining toward one, as the short-term holders are only realizing marginal profits. If this trend continues, the market can be overwhelmed by excess supply as holders seek to offload their coins with minimal losses.