
Shiba Inu Slips to 7-Day Low—Can Bulls Turn the Tide Before Q2 Closes?

Shiba Inu (SHIB) has slumped to a seven-day low, driven by global uncertainty and bearish technical signals. The token faces critical support at $0.0000102, with further losses possible.
Leading meme coin Shiba Inu (SHIB) has plunged to a seven-day low, dropping nearly 15% over the past week. At press time, the altcoin trades at $0.0000116.
The downturn comes amid escalating tensions in the Middle East, which have cast a shadow over broader crypto market sentiment and triggered a wave of risk-off behavior among SHIB holders.
SHIB Traders Brace for More Losses
On the technical front, momentum indicators suggest that the meme coin may face further losses in the short term. For example, the token’s BBTrend remains red on the daily chart, confirming that bearish forces are firmly in control.
 SHIB BBTrend. Source:
TradingView
The BBTrend measures the strength and direction of a trend based on the expansion and contraction of Bollinger Bands. When BBTrend values are positive, it typically signals a strong uptrend, while negative values indicate increasing bearish momentum.
Observed on the one-day chart, SHIB’s BBTrend indicator has posted red histogram bars that have gradually increased in size over the past 13 days. This signals strengthening sell-side pressure among the token’s spot traders.
Furthermore, the meme coin’s Elder-Ray Index supports this bearish outlook. At press time, the indicator is below zero at -0.0000011.
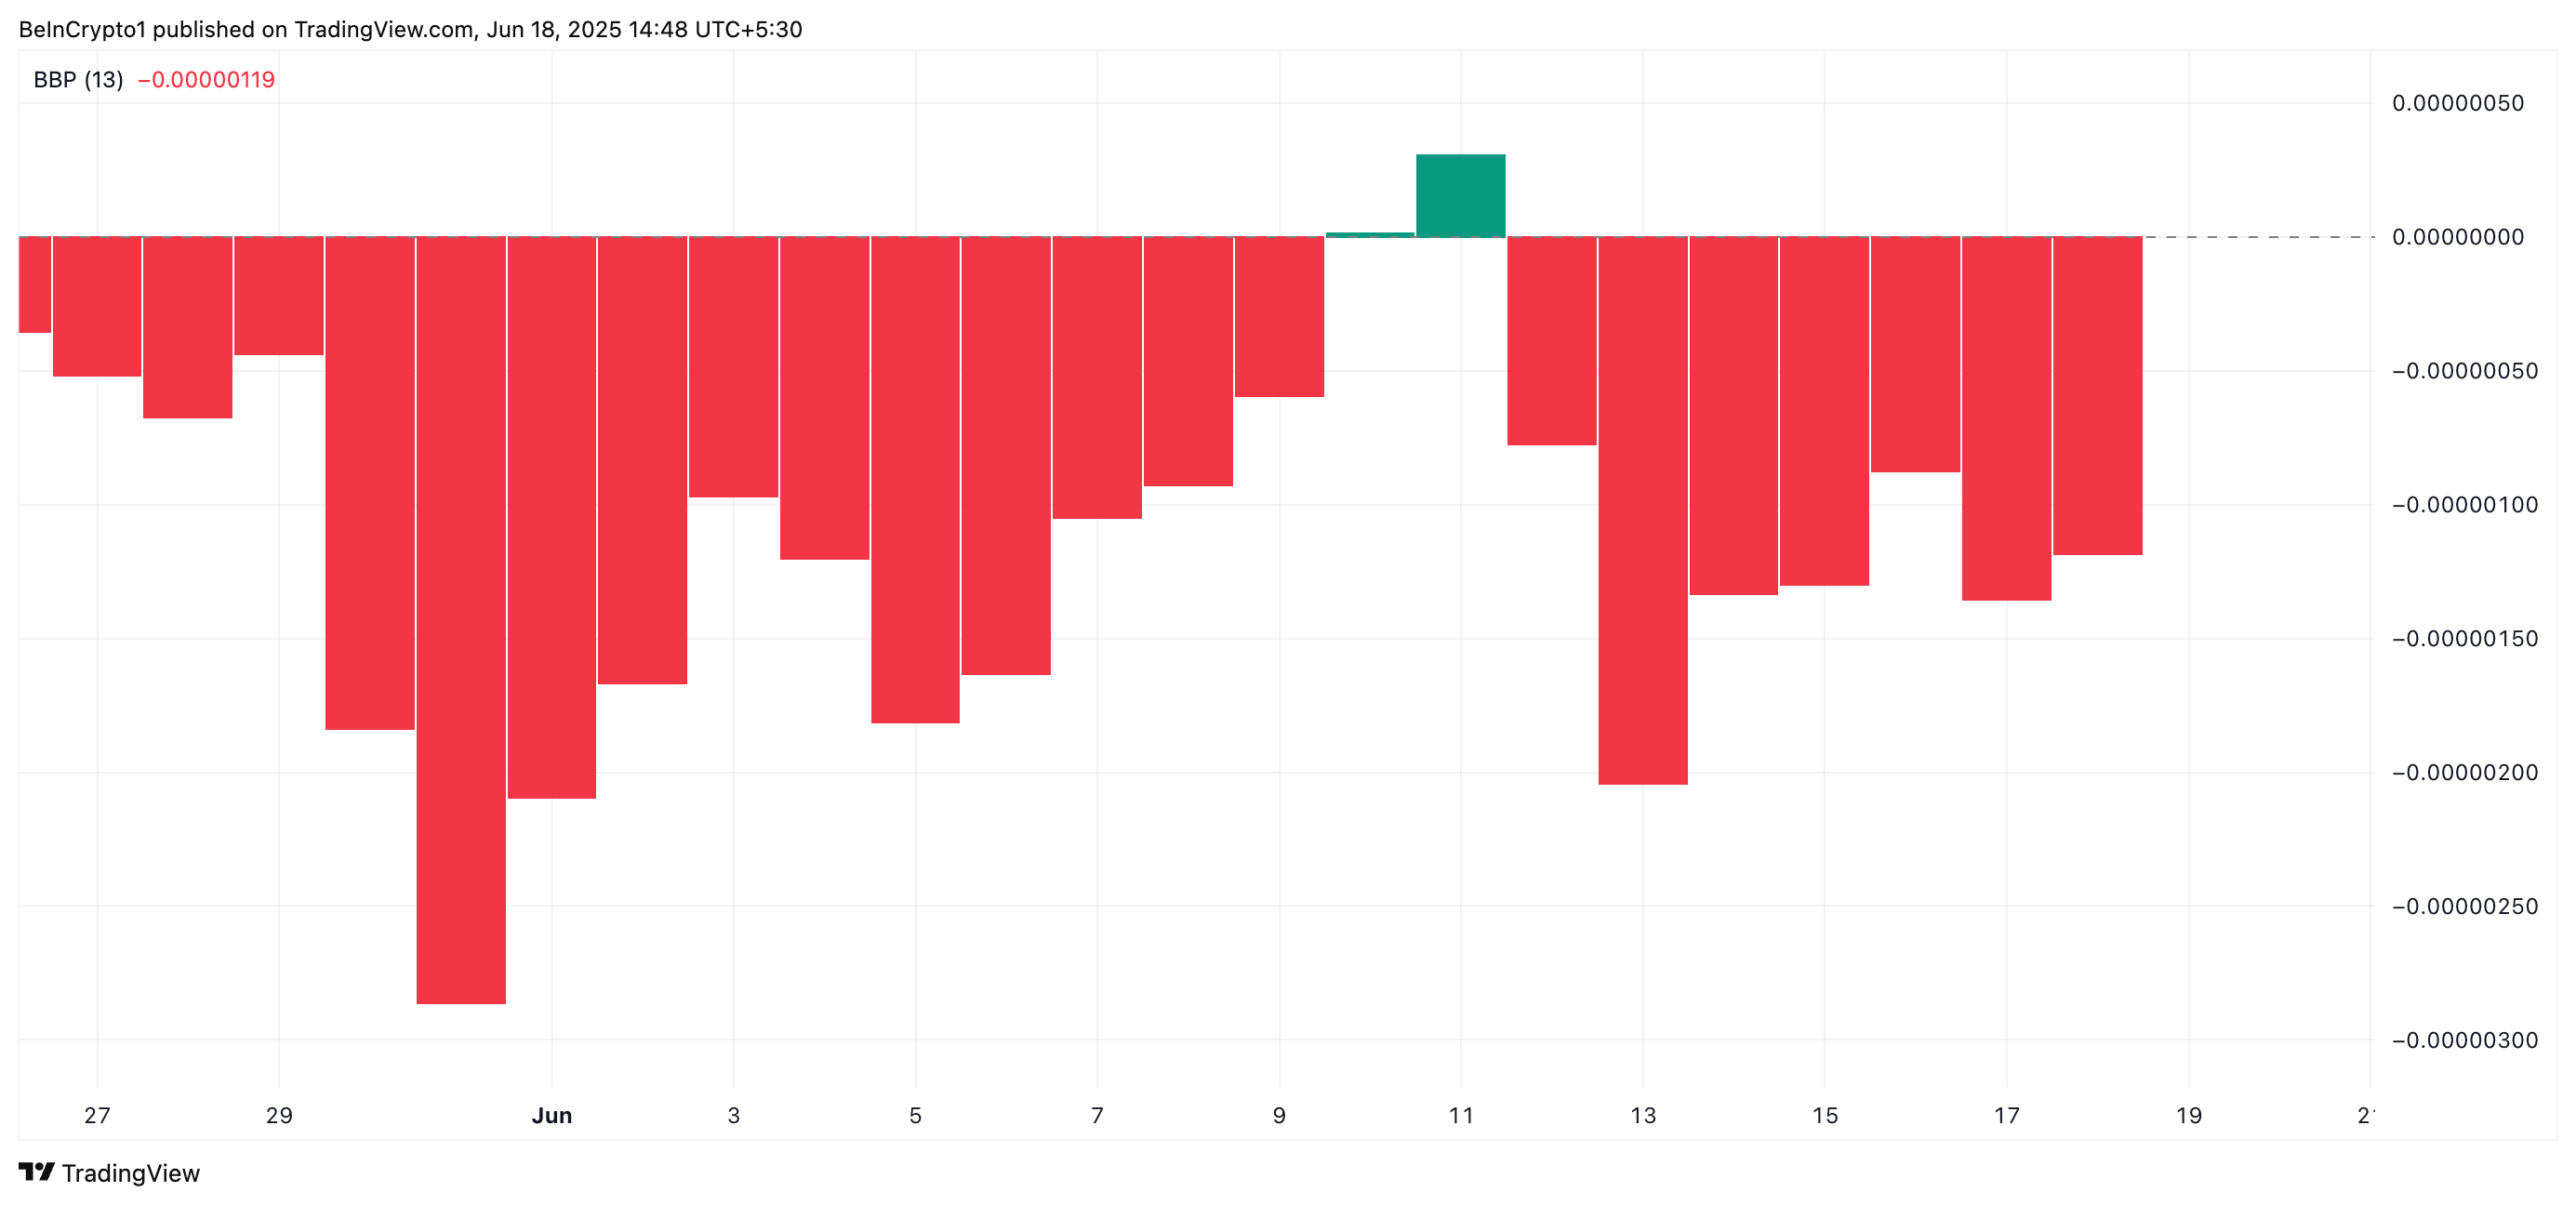 SHIB Elder-Ray Index. Source:
TradingView
The Elder Ray Index measures the strength of buying and selling pressure in the market, using two key components: Bull Power and Bear Power. When the index is negative, sellers dominate the market. This confirms the bearish trend in the SHIB markets and hints at a continued downward momentum in the short term.
Can SHIB Hold the Line?
SHIB currently trades just above the key support level at $0.0000102, a price floor last tested in April. If bearish pressure intensifies, SHIB could retest this critical zone.
If the support level fails to hold, a further decline in market sentiment and weak demand may drive the token toward $0.00000939.
 SHIB Price Analysis. Source:
TradingView
Conversely, if bullish momentum builds and buyer interest returns, the Shiba Inu token price could stage a recovery, with a potential upside target near $0.0000122.
Disclaimer: The content of this article solely reflects the author's opinion and does not represent the platform in any capacity. This article is not intended to serve as a reference for making investment decisions.
You may also like
Apple Prints TD Sequential Sell 9 — Last Two Led to 15.66% and 13.63% Corrections

The Collapse of "Consensus Trading" and the Birth of a New Consensus! Goldman Sachs Explains: Why Institutions Are Currently Significantly Reducing AI Holdings
The extremely crowded trade of "going long on AI, short on everything else" is undergoing a painful unwinding—markets are no longer satisfied with the "burn rate narrative." Mega-scale cloud providers must deliver real, visible revenue conversions alongside $1.1 trillion in capital expenditures. A power gap of 40-50 gigawatts, rising capital costs, and a macro paradigm shift from an era of "overspending" are turning AI trades from a matter of faith into a harsh test of monetization.
Starknet TVL crashes 3.7x to $42M after getting 93% vote to become L1
Pundit to XRP Holders: Listen to This SWIFT Interview With Finextra Research

Crypto prices
More


