Bitget App
Trade smarter
Buy cryptoMarketsTradeFuturesStocksEarnInstitutionAI & More
Hedera (HBAR) Chart Pattern Signals Big Move Ahead — Breakout or Breakdown?

Hedera (HBAR) Chart Pattern Signals Big Move Ahead — Breakout or Breakdown?

CoinsProbeCoinsProbe2025/08/26 14:50
By:Nilesh Hembade

Date: Tue, Aug 26, 2025 | 11:32 AM GMT

The cryptocurrency market is facing a sharp decline as Bitcoin (BTC) has retraced to $110K from its recent high of $117K, while Ethereum (ETH) has dipped 3% today to $4,425, adding downside pressure on major altcoins , including Hedera (HBAR).

HBAR is currently trading in the red, approaching a key support area that could dictate its next move.
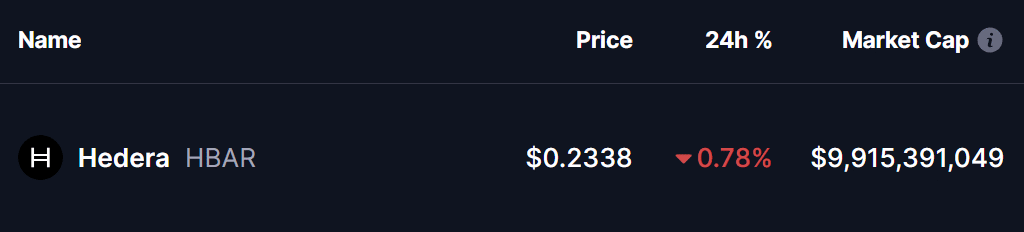
Hedera (HBAR) Chart Pattern Signals Big Move Ahead — Breakout or Breakdown? image 0 Source: Coinmarketcap

Descending Triangle in Play

On the daily chart, HBAR has been consolidating inside a descending triangle pattern — a formation that is typically viewed as a bearish continuation structure, where lower highs tighten against a flat support base until a decisive move occurs.

So far, HBAR has managed to defend support around $0.2260, despite several retests. Each dip toward this zone has been met with steady buying, suggesting accumulation by strong hands. Currently, HBAR trades at $0.2341, just below the 50-day moving average at $0.245 and its descending trendline resistance.
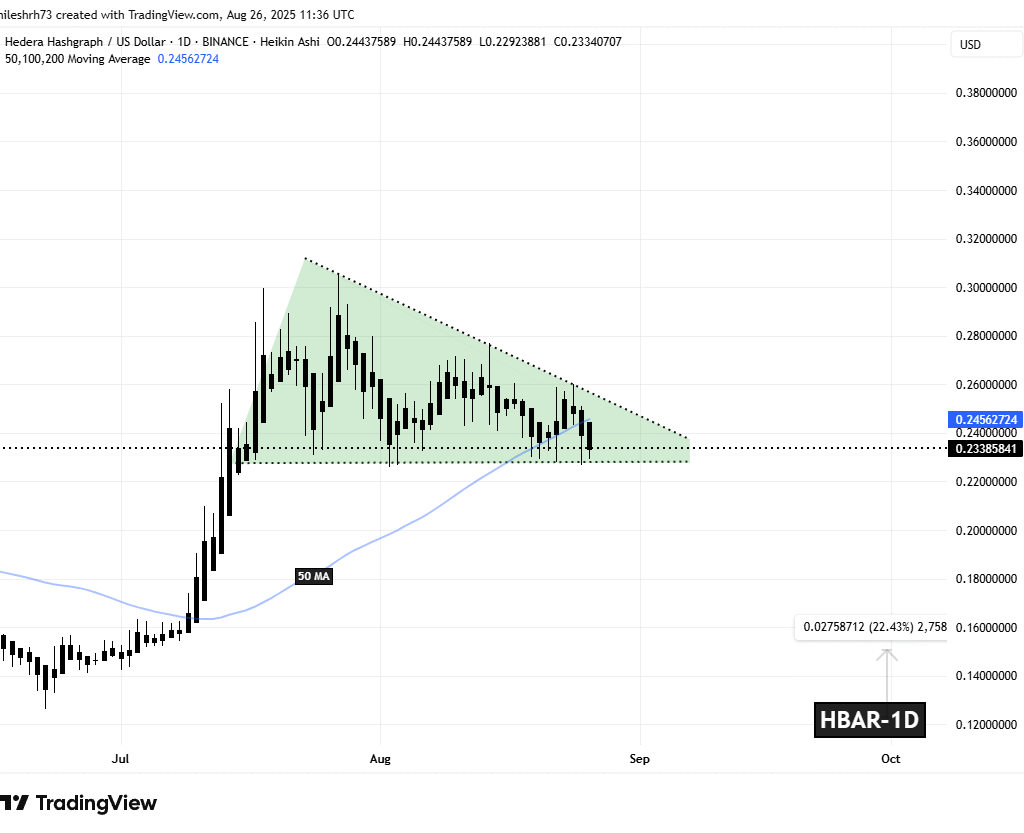
Hedera (HBAR) Chart Pattern Signals Big Move Ahead — Breakout or Breakdown? image 1 Hedera (HBAR) Daily Chart/Coinsprobe (Source: Tradingview)

This setup places HBAR right at the apex of the triangle, where a decisive move — either up or down — is increasingly likely.

What’s Next for HBAR?

If bulls succeed in breaking out above the 50-day MA and descending trendline, momentum could accelerate toward $0.3052, marking a gain of nearly 30% from current levels. Such a breakout would signal strong reversal strength and could attract fresh buyers.

However, if $0.2259 support fails, the bearish triangle thesis would be confirmed. In that scenario, HBAR could decline toward $0.1466, based on the height of the pattern — a drop of more than 35%.

0
0

Disclaimer: The content of this article solely reflects the author's opinion and does not represent the platform in any capacity. This article is not intended to serve as a reference for making investment decisions.

Understand the market, then trade.
Bitget offers one-stop trading for cryptocurrencies, stocks, and gold.
Trade now!

You may also like

The Reserve Bank of India’s Efforts to Save the Rupee Deplete Reserves: $50 Billion Plunge in Forex Holdings, $200 Billion Forward Dollar Liabilities Become a Ticking Time Bomb

Foreign investors have made net sales of $31 billion in Indian stocks this year, and administrative controls are accelerating hedging demand towards the offshore NDF market, with the effectiveness of interventions continuously diminishing. The most critical risk lies in the fact that the yield spread between Indian and US 10-year government bonds has sharply dropped from 600 basis points in 2013 to just 200 basis points, with the traditional interest rate defense line nearly breached. India faces a dilemma: persisting on the current path will exhaust policy space, while relying on rate hikes to rebuild the yield spread would directly stifle economic growth.

华尔街见闻•2026/10/14 04:22
The Reserve Bank of India’s Efforts to Save the Rupee Deplete Reserves: $50 Billion Plunge in Forex Holdings, $200 Billion Forward Dollar Liabilities Become a Ticking Time Bomb

As Starlink challenges telecom operators' pricing power, AT&T (T.US) sells its Mexico business for $2 billion, shifting focus to AI connectivity demand.

AT&T has agreed to sell its Mexico operations to Televisa and Fintech for $2 billion. The transaction is expected to be completed in the first quarter of 2027, pending approval from Mexican regulators.

智通财经•2026/10/14 03:32
As Starlink challenges telecom operators' pricing power, AT&T (T.US) sells its Mexico business for $2 billion, shifting focus to AI connectivity demand.

Dovish Signals Boost Markets: Asia-Pacific Stocks Rebound, South Korea Shares Jump Over 1% Ending Five-Day Slide, Taiyo Yuden Surges 7%

On Wednesday, the MSCI Asia-Pacific Index rose by 0.2%, making a slight rebound from the low point reached on Tuesday, the lowest since August. South Korea's Composite Index briefly rose by over 2%. SK Hynix and Samsung Electronics both surged more than 3% during trading, then fell back. The Nikkei 225 expanded its gains to 0.53%. MLCC giant Taiyo Yuden led the AI hardware sector, while Fujikura rose nearly 4%. The yield on 10-year US Treasury futures remained at 5.21%, up 0.5 basis points from Tuesday.

华尔街见闻•2026/10/14 03:02
Dovish Signals Boost Markets: Asia-Pacific Stocks Rebound, South Korea Shares Jump Over 1% Ending Five-Day Slide, Taiyo Yuden Surges 7%