Ethereum is undergoing a decisive retest between $4,200 and $4,400 after clearing multi‑year resistance; holding this zone supports further upside to $4,843, $5,579 and $6,407, while a failure risks a decline toward $3,900 and deeper Fibonacci supports.
-
Immediate support: $4,200–$4,400 — hold this zone to keep bullish targets intact.
-
Key indicators: RSI ~54.53 and Bollinger Bands show elevated volatility with upper band near $4,905.
-
Upside targets: $4,843, $5,579, $6,407; downside pivots: $3,900, $3,436, $3,020.
Ethereum retest at $4,200–$4,400: expert breakdown of support, indicators, and trade levels — monitor weekly close for direction.
What is the current Ethereum retest and why does it matter?
Ethereum retest refers to ETH revisiting the $4,200–$4,400 zone after breaking multi‑year resistance. This retest matters because a successful hold confirms a breakout and opens targets near $4,843, $5,579 and $6,407, while failure increases the odds of a slide to lower Fibonacci supports.
How strong is the $4,200–$4,400 support zone?
The $4,200–$4,400 area aligns with the 0.382 Fibonacci retracement and marks the first major test since the breakout. At press time ETH traded at $4,407.53, down 0.62% on the day, with a session high of $4,454.55 and low of $4,318.17. The RSI cooling to 54.53 indicates the immediate momentum has normalized from prior overbought conditions.
Ethereum faces a decisive retest at $4,200 to $4,400 after breaking multi year resistance, with targets set at $4,843, $5,579, and $6,407.
- Ethereum trades near $4,407 after rejection at $4,800, testing crucial support between $4,200 and $4,400.
- Analyst Rose highlights upside targets of $4,843, $5,579, and $6,407 if Ethereum holds above the current retest zone.
- RSI cools to 54.53 while Bollinger Bands suggest volatility, leaving Ethereum’s next direction dependent on weekly close.
Ethereum is moving through a decisive phase after breaking a multi year resistance zone earlier this month. ETH surged close to $4,800 before facing rejection and retreating toward $4,400.
According to analyst Rose, the current pullback is the first major test of the breakout, with a retest zone forming between $4,200 and $4,400. The outcome of this phase could determine whether Ethereum advances toward higher resistance levels or slides back toward Fibonacci retracement zones.
When will the retest confirm a new bullish leg?
A weekly close above the $4,400–$4,500 range, with follow‑through clearing $4,800–$4,900 resistance, would signal confirmation of the breakout. Short term, traders should watch the weekly close and volume for conviction; sustained volume on a reclaim of $4,800 increases the probability of moves to $5,579 and $6,407.
What do indicators say about short‑term consolidation?
The Bollinger Bands show elevated volatility: the upper band sits near $4,905 and the lower band around $3,897. Ethereum is trading just above the middle band at $4,401, indicating consolidation. The RSI at 54.53 has cooled from overbought levels, suggesting momentum has paused but is not bearish.
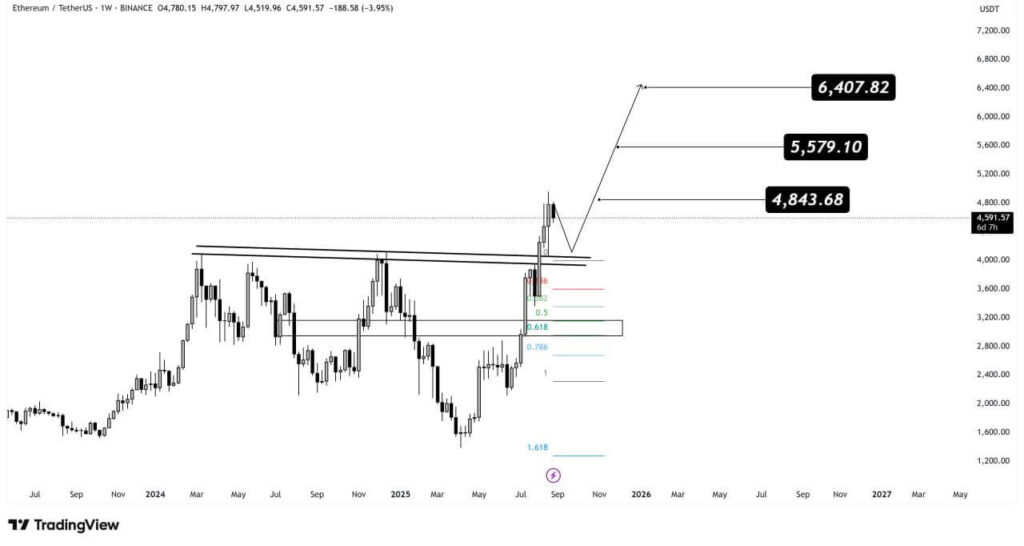 ETH/USDT 1-week price chart, Source: Rose on X
Notably, the breakout above a descending resistance trendline that capped multiple attempts throughout 2024 and early 2025 has set up this critical retest. The outlined support zone aligns with the 0.382 retracement level near $3,852, marking a key threshold for market strength.
How should traders size risk around the retest?
Risk sizing should prioritize defined stops and tiered position entries: enter partial positions near the $4,200–$4,400 support with stops below $4,000, and add on confirmed reclaim of $4,800 with stops trailed beneath new support. Use position sizing that limits portfolio exposure to manageable levels given elevated volatility.
What are the upside and downside scenarios?
Upside: If the retest holds, analyst Rose’s targets at $4,843, $5,579 and $6,407 remain reachable. A decisive break above $4,900 would likely accelerate gains. Downside: A failure to hold $4,400 may push ETH to the lower Bollinger Band around $3,900, with further declines to Fibonacci levels at $3,436 and $3,020.
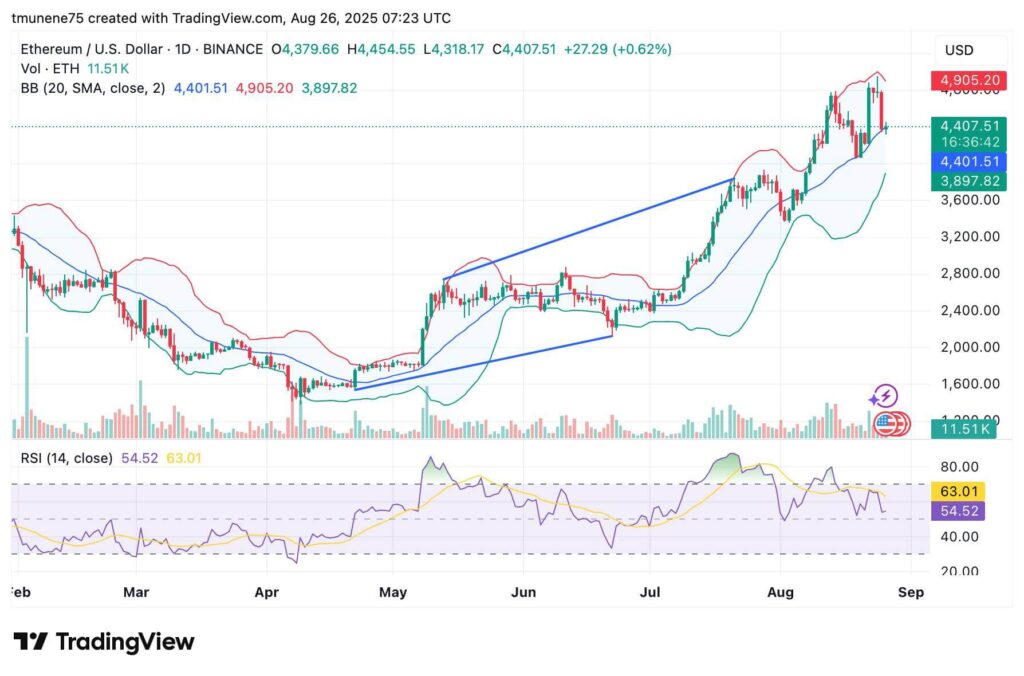 ETH/USD 1-day price chart, Source: TradingView
How to interpret weekly closes and momentum?
Weekly closes define macro direction: a weekly close above $4,500 with rising volume suggests continuation, while a close below $4,200 with expanding selling volume signals a deeper correction. Monitor RSI and MACD cross behavior on the weekly chart for confirmation of momentum shifts.
Frequently Asked Questions
What is the most likely short‑term outcome for Ethereum?
The most likely short‑term outcome is consolidation inside $4,200–$4,900. Holding the lower retest zone keeps the path to higher targets intact; a decisive weekly close below $4,200 would increase downside risk.
How should long‑term investors view this retest?
Long‑term investors should view a successful retest as confirmation of structural strength after breaking multi‑year resistance, but they should consider scaling into positions and managing risk around the outlined Fibonacci supports.
Key Takeaways
- Retest zone: $4,200–$4,400 is the immediate pivot for confirming the breakout.
- Indicators: RSI ~54.53 and Bollinger Bands signal consolidation with elevated volatility.
- Actionable levels: Upside targets $4,843, $5,579, $6,407; downside pivots $3,900, $3,436, $3,020 — manage stops and size positions accordingly.
Conclusion
Ethereum’s move through the $4,200–$4,400 retest will define the next leg of its trend. COINOTAG analysis shows that holding this zone supports further gains to $4,843–$6,407, while failure increases the risk of returns to key Fibonacci levels. Monitor weekly closes, volume and momentum indicators to act decisively.