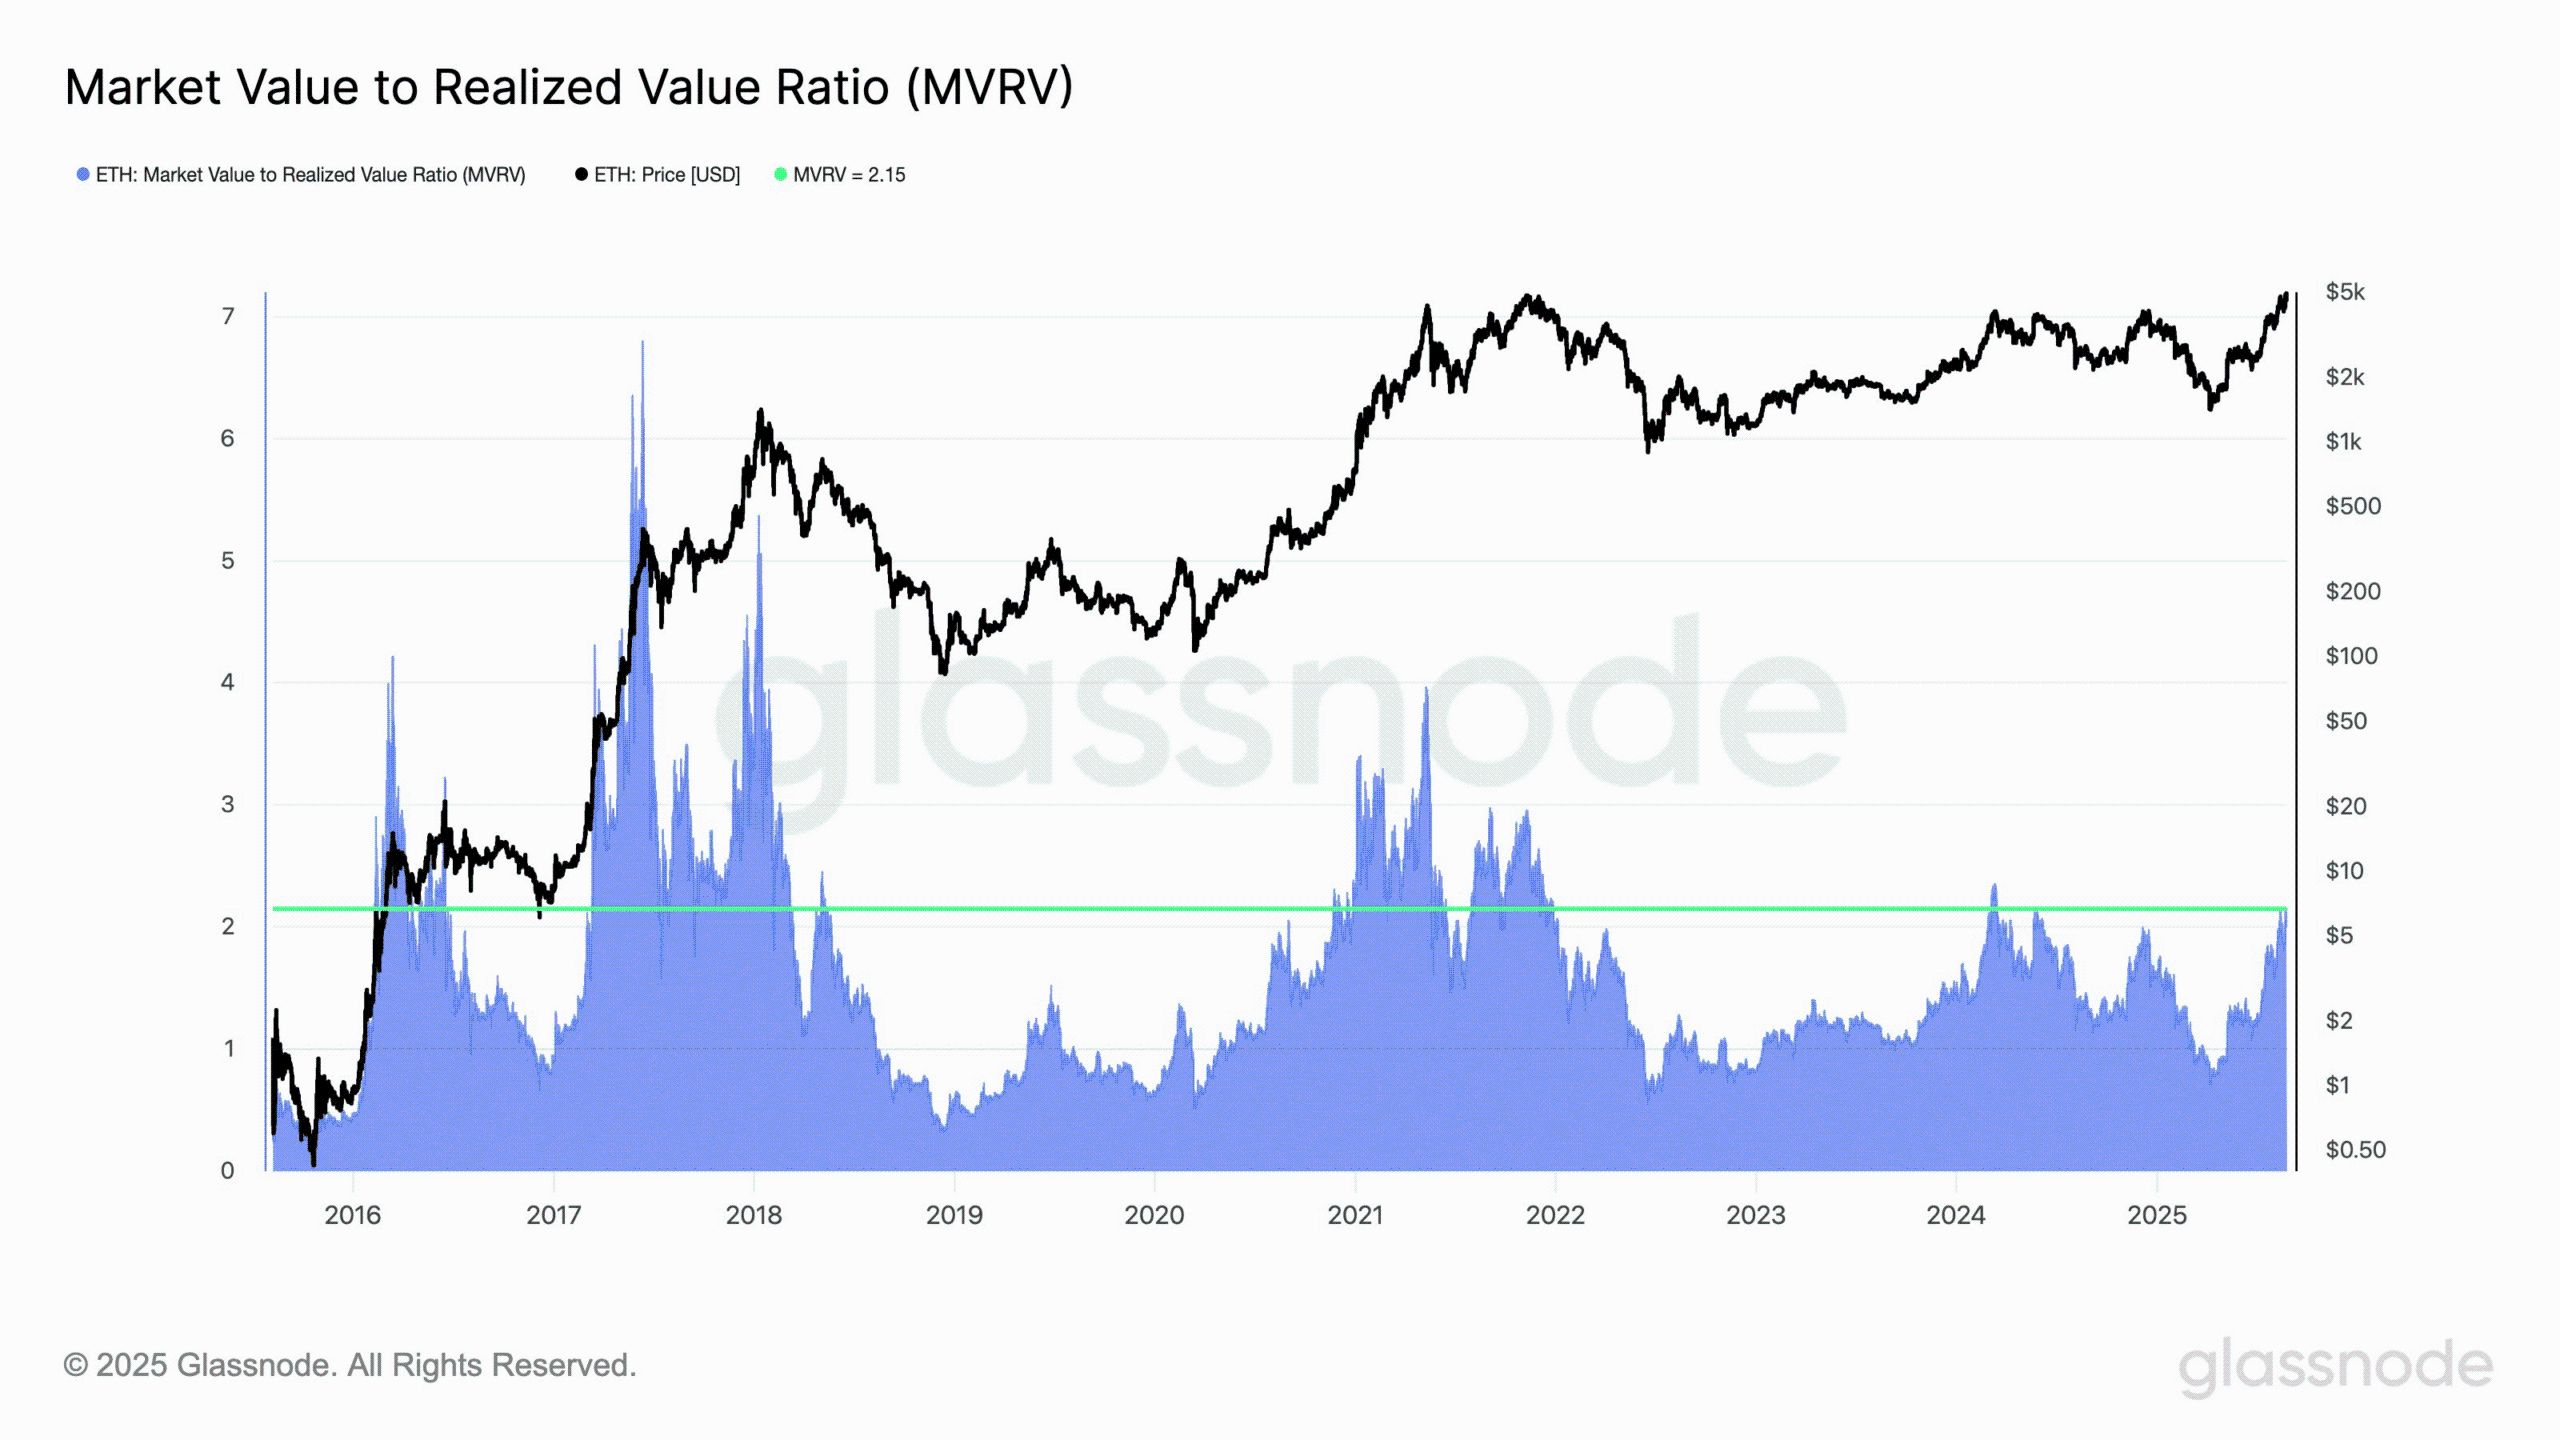
Ethereum MVRV sits near 2.10 with ETH trading around $4,500, signaling a near-term overextension: on-chain deleveraging erased roughly $10 billion in leverage, increasing the probability of a pullback before any sustainable upside. Monitor MVRV and Open Interest for entry signals.
-
ETH price: $4,500 — MVRV ~2.10, near historical local-top thresholds
-
On-chain: Open Interest fell ~7% in one session; ~ $10B in leveraged positions liquidated.
-
Historical context: prior MVRV spikes preceded significant corrections; traders should watch accumulation zones and liquidity pools.
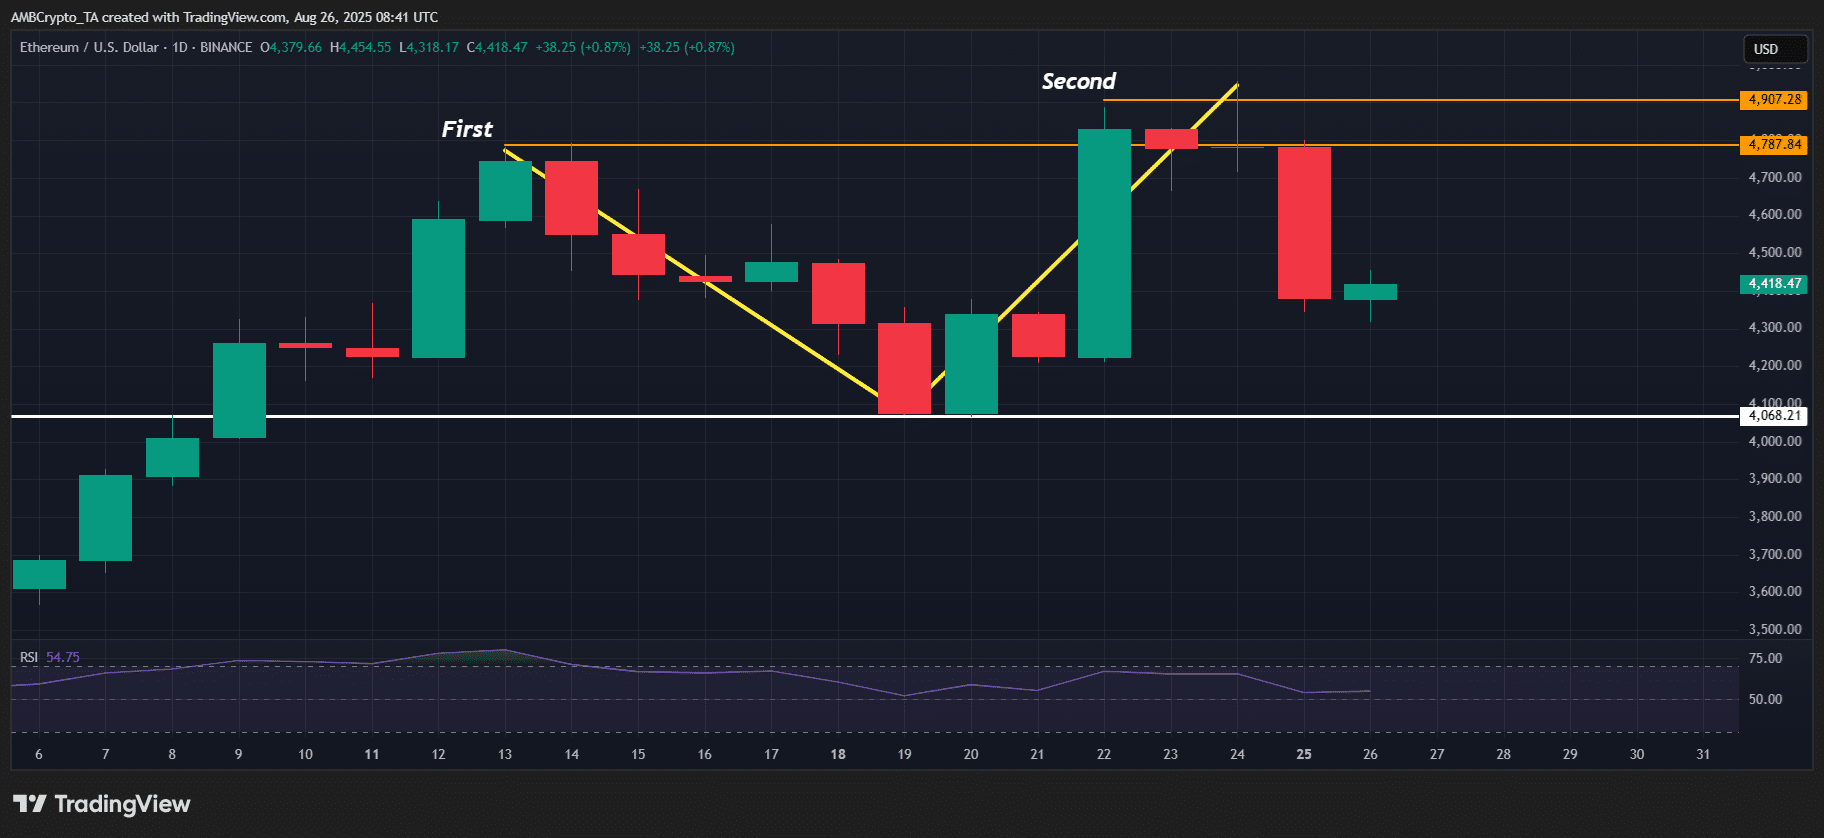
Ethereum MVRV at 2.10 with ETH ~ $4,500 — watch MVRV and Open Interest for pullback signals before buying the next leg. Read how to trade this setup.
What is Ethereum MVRV telling traders now?
Ethereum MVRV measures market value relative to realized value and currently suggests near-term overextension as ETH trades near $4,500 with MVRV ~2.10. Historically, similar MVRV spikes have coincided with local tops, so this metric warns of heightened profit-taking risk while highlighting potential accumulation zones.
How did recent on-chain Open Interest and liquidations influence ETH price action?
Open Interest retraced nearly 7% in a single session, and roughly $10 billion of leveraged positions were removed in three days. This rapid deleveraging reduced short-term convexity and amplified volatility. Data from Glassnode and trading feeds show these events often precede consolidation or deeper corrections.
Frequently Asked Questions
Is MVRV a reliable top indicator for ETH?
MVRV reliably highlights periods of elevated unrealized gains and has historically coincided with local tops for ETH. Use it as a risk-management tool, not a standalone signal, and confirm with volume and liquidity data. Glassnode and historical cycle analysis support this use case.
How can traders act on a high MVRV reading?
Traders should reduce leveraged exposure, tighten stop-losses, and look for buy-the-dip zones defined by prior accumulation and realized price bands. Consider phased entries and risk-to-reward alignment rather than full-size positions on immediate pullbacks.
How to trade ETH when MVRV spikes
Step 1: Reduce leverage and check Open Interest and exchange flows.
Step 2: Identify support zones near realized prices and historical accumulation ranges.
Step 3: Use phased entries and strict risk management; avoid chasing runs driven by FOMO.
Key Takeaways
- MVRV warns of overextension: Ethereum MVRV near 2.10 historically aligns with local tops and heightened profit-taking risk.
- Deleveraging reduced leverage: Roughly $10B in leveraged positions were liquidated and Open Interest fell ~7% in a session.
- Trade with confirmation: Combine MVRV with OI, exchange flows and support zones; prefer phased entries and strict risk management.
Conclusion
Ethereum is at a critical juncture: with ETH around $4,500 and MVRV near 2.10, on-chain deleveraging removed significant leverage and elevated short-term risk. Traders should prioritize risk controls, monitor Open Interest and accumulation metrics, and wait for confirmed support before committing to new long positions. COINOTAG will continue to track on-chain indicators and update coverage as the picture evolves.
Source attribution: on-chain metrics referenced from Glassnode; price charts from TradingView (ETH/USDT). Publication date: 2025-08-26. Author: COINOTAG.
Source: Glassnode
Source: TradingView (ETH/USDT)