
ETH chart pattern projects rally to $2.5K if key conditions are met: Data

Ether (ETH) opened the week with a drop below the psychological $2,000 level, placing the altcoin into a 20% loss for February. Still, onchain data shows long-term investors accumulating ETH and rising network usage.
Now, analysts are examining how ETH’s technical outlook and the derivatives data align with its emerging demand to determine if a prolonged rally above $2,000 is possible.
Key takeaways:
Over 2.5 million ETH flowed into accumulation addresses in February, lifting holdings to 26.7 million for 2026.
Ethereum weekly transactions hit 17.3 million as the median fees fell to $0.008, a 3,000x drop from 2021 peaks.
ETH open interest dropped to $11.2 billion, but leverage remains elevated, with liquidation clusters stacked near $1,909 and $2,200.
Ether accumulation grows despite price drop
Ether accumulation addresses added more than 2.5 million ETH in February, even as the price declined around 20%. Total holdings have risen to 26.7 million ETH, up from 22 million at the beginning of 2026.
 ETH balance on accumulation addresses. Source: CryptoQuant
MN Capital founder Michaël van de Poppe noted that ETH valued against silver is at its lowest level on record, arguing that such difficult market phases often present a long-term accumulation window.
The network demand is also improving alongside improving fundamentals. Over 30% of ETH’s circulating supply (37,228,911 ETH) is currently staked, reducing the liquid supply. At the same time, weekly transaction count reached an all-time high of 17.3 million, while median fees fell to $0.008.
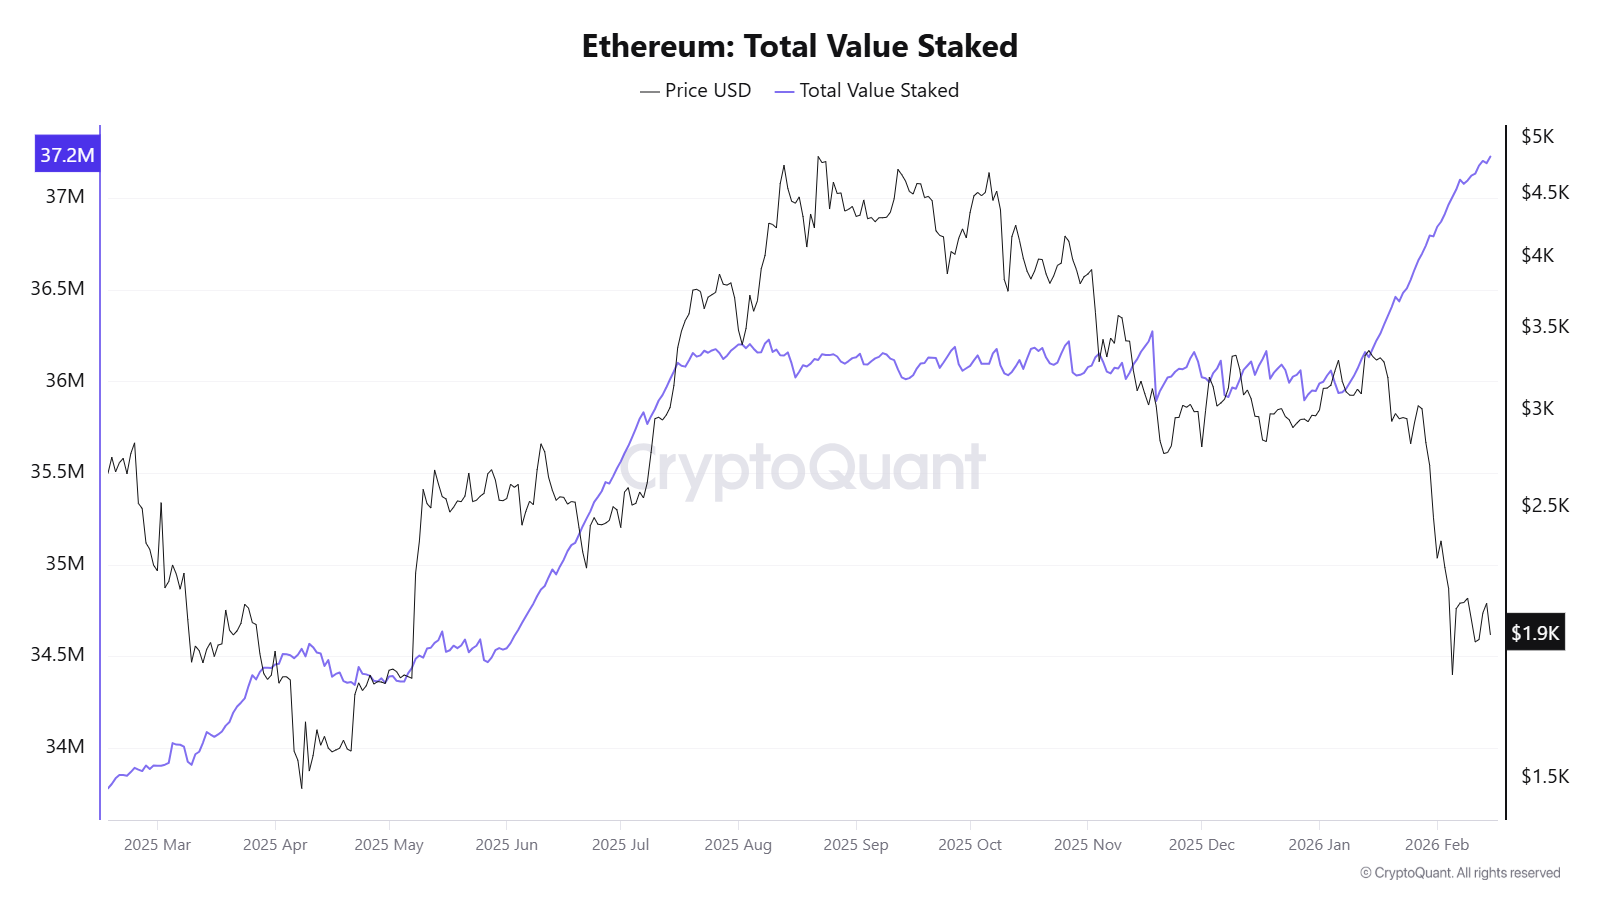 Ether total value staked. Source: CryptoQuant
In comparison, head of research at Lisk, Leon Waidmann, noted that the weekly transactions were near 21 million, but the median fees surged above $25 during the 2021 peak. The current structure reflects a higher usage at significantly lower cost.
Related: Harvard endowment reduces stake in Bitcoin ETF, adds Ether exposure
ETH compresses below $2,000 as leveraged traders brace for a breakout
On the four-hour chart, Ether appears to be forming an Adam and Eve bottom, a bullish reversal setup that begins with a sharp, V-shaped low (the “Adam”) followed by a slower, rounded base (the “Eve”).
The structure reflects an initial aggressive sell-off that quickly finds buyers, then a period of gradual accumulation as the volatility contracts.
 ETH/USDT 4-hour chart. Source:
Cointelegraph/TradingView
A confirmed breakout above the $2,150 neckline validates the pattern and may open the door toward the $2,473–$2,634 region, based on the measured move projection from the base. The invalidation remains below recent higher lows, with $1,909 acting as a key short-term liquidity level.
Open interest has declined to $11.2 billion from a $30 billion cycle peak in August 2025. However, the estimated leverage ratio remains elevated at 0.7, only slightly down from 0.77 in January. This suggests leverage is still concentrated in the system, increasing the possibility of a sharp move.
 Percentage of ETH Global accounts long on Binance. Source: Hyblock
Hyblock data shows that 73% of the global accounts are currently long on ETH. Liquidation heatmaps show more than $2 billion in short positions clustered above $2,200, compared with roughly $1 billion in long liquidations stacked near $1,800, highlighting a heavier squeeze risk to the upside.
Although the nearest dense cluster sits at $1,909, where $563 million in longs are vulnerable, which may act as a potential short-term liquidity magnet before the expected uptrend.
 ETH liquidation map. Source: CoinGlass
Related: Crypto funds log fourth week of outflows at $173M as BTC dips below $70K
Disclaimer: The content of this article solely reflects the author's opinion and does not represent the platform in any capacity. This article is not intended to serve as a reference for making investment decisions.
You may also like
The Collapse of "Consensus Trading" and the Birth of a New Consensus! Goldman Sachs Explains: Why Institutions Are Currently Significantly Reducing AI Holdings
The extremely crowded trade of "going long on AI, short on everything else" is undergoing a painful unwinding—markets are no longer satisfied with the "burn rate narrative." Mega-scale cloud providers must deliver real, visible revenue conversions alongside $1.1 trillion in capital expenditures. A power gap of 40-50 gigawatts, rising capital costs, and a macro paradigm shift from an era of "overspending" are turning AI trades from a matter of faith into a harsh test of monetization.

Starknet TVL crashes 3.7x to $42M after getting 93% vote to become L1
Pundit to XRP Holders: Listen to This SWIFT Interview With Finextra Research

AI Capital Expenditure Faces a Dilemma: Accelerating Puts Pressure on Cash Flow, Slowing Down Undermines the Growth Narrative
Nomura Securities believes that the AI investment narrative is mired in an internal contradiction: if hyperscale cloud providers accelerate capital expenditures, their free cash flow will continue to be drained, raising doubts about the sustainability of financing; if they slow down, it would indicate a loss of confidence in AI demand and profitability expectations. Both paths lead to sell-offs. The crowded long positions accumulated during the AI agent boom in September have triggered large-scale stop-losses under negative catalysts, spreading to US Treasury bonds, exchange rates, and commodity markets, resulting in systemic deleveraging.

Crypto prices
More


