
A Chart: Overview of "Pivot Points + Long and Short Position Signals" for Gold, Crude Oil, Forex, and Stock Indexes on June 16, 2026

Forex Web, June 16—— The following is the latest in the "One Chart Series": a glance at the "Pivot Point + Long and Short Position Signals" across gold, oil, forex, and stock indices. It includes both chart interpretations and textual explanations. By comparing the most recent net long % with the previous trading day's net long % (yesterday's net long %), we interpret a total of 13 types of position signals, including: net longs expanding, net longs decreasing, no change in net shorts, net shorts shifting to balanced positions, etc. Only some of these signals are shown, based on the actual data comparison results.
One Chart: Overview of Gold, Oil, Forex, Stock Indices “Pivot Point + Long and Short Position Signals” for June 16, 2026. The latest data released today (Tuesday, 2026/06/16) shows that, as of just now, there are 1 asset in this chart currently in an "overbought" state (longs over 80%), and 4 assets in an "oversold" state (longs below 20%). Among them, spot gold XAU/USD has the highest proportion of long positions: 86% long on XAU/USD, 63% long on US crude oil WTI OIL, and 50% long on EUR/USD. For more details on the changes compared to yesterday and a detailed list, please refer to the dedicated Forex News chart.
Among change signals in positions: 4 have net longs expanding, 6 have net longs decreasing, 9 have net shorts expanding, 1 has net shorts decreasing, and 1 has net shorts shifting to balance. Assets where positions are at or above 80% include: spot gold XAU/USD at 86% long. EUR/JPY is 84% short, USD/JPY is 94% short, and USD/CAD is 86% short.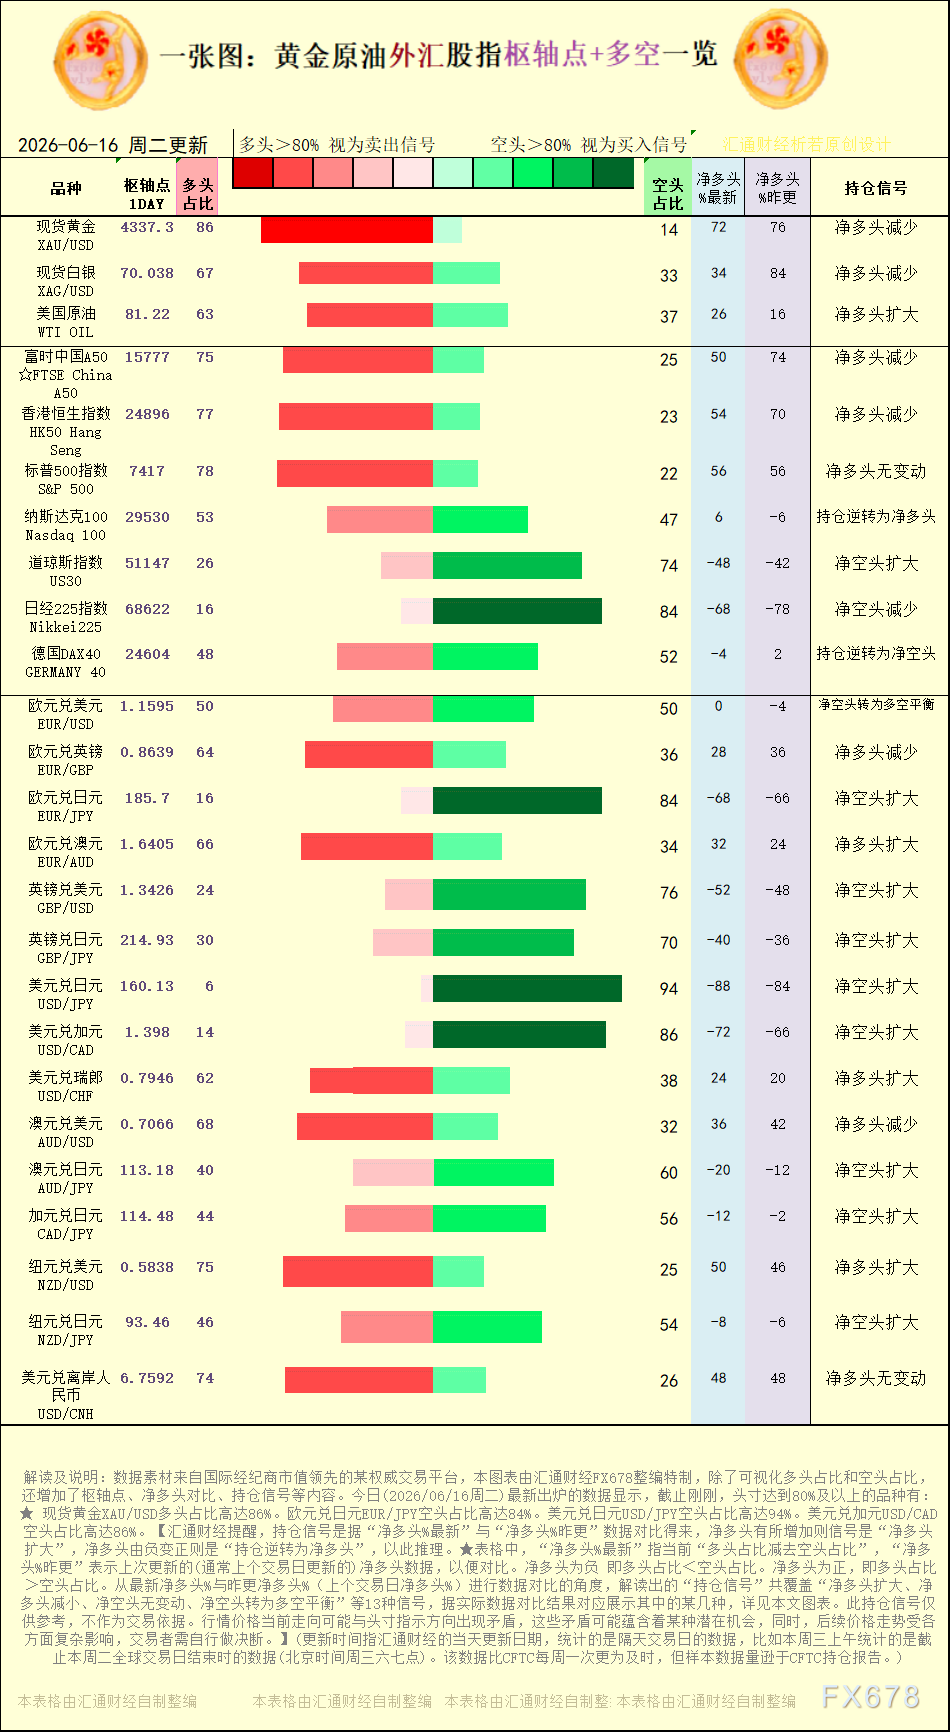
[Chart: Interpretation of pivot points and long/short position signals for gold, oil, forex, and stock indices, source: Custom chart by Forex News. (Click image to enlarge)]
Net shorts decreased in: Nikkei225 Index.
Net longs expanded in: US crude oil WTI OIL, EUR/AUD, USD/CHF, NZD/USD. Net longs decreased in: spot gold XAU/USD, spot silver XAG/USD, EUR/GBP, AUD/USD.
Forex News reminds readers that position signals are derived by comparing "latest net long %" with "yesterday net long %". If net longs have increased, the signal is "net longs expanding"; if net longs turn from negative to positive, it means "the position has reversed to net long", and so forth. ★ In the table, "latest net long %" refers to the current "long proportion minus short proportion", and "yesterday net long %" refers to the most recent update's (usually previous trading day's) net long data, for comparison. Net long being negative means long proportion short proportion. Interpreted from the angle of latest net long % vs. yesterday's net long %, the "position signals" cover a total of 13 types, such as "net longs expanding, net longs decreasing, no change in net shorts, net shorts shifting to balanced", etc. Actual signals shown will depend on the data, as detailed in the chart in this article.
[Trading assets involved in this chart: spot gold, spot silver, US crude oil, S&P 500 Index, Nasdaq 100, Dow Jones Index, DAX40 Germany, EUR/USD, EUR/GBP, EUR/JPY, EUR/AUD, GBP/USD, GBP/JPY, USD/JPY, USD/CAD, USD/CHF, AUD/USD, AUD/JPY, CAD/JPY, NZD/USD.]
Disclaimer: The content of this article solely reflects the author's opinion and does not represent the platform in any capacity. This article is not intended to serve as a reference for making investment decisions.
You may also like
Bitcoin ETF See $463 Million Exit In Just Four Sessions

Avalanche advances as AVAX retakes $7.00, UAE expands blockchain use
Peter Brandt Breaks Down Market Speculation With Warning to Retail Crypto Traders

Cardano Price Today Stalls at $0.21 While Minswap Fees Jump 92%

Crypto prices
More


