
One Chart: Overview of "Pivot Points + Long/Short Position Signals" for Gold, Crude Oil, Forex, and Stock Indices on July 15, 2026

Huitong Network, July 15 — Below is the latest chart in the “Pivot Points + Long/Short Positioning Signals” series for gold, crude oil, forex, and stock indices, including chart interpretation and written analysis. By comparing the latest net long % with yesterday’s updated net long % (net long % of the previous trading day), 13 different types of position signals are interpreted, covering signals such as net long expansion, net long reduction, no change in net short, net short turning into balanced positions, etc. Depending on actual data comparison results, several types will be shown.
One Chart: An overview of “Pivot Points + Long/Short Positioning Signals” for gold, crude oil, forex, and stock indices on July 15, 2026. Today's (Wednesday, July 15, 2026) latest data show that as of just now, among the assets in this chart, there are 6 assets currently in an “overbought” state (long positions above 80%), and 3 assets currently in an “oversold” state (long positions below 20%). Among them, the asset with the highest proportion of long positions is spot gold XAU/USD, with long positions accounting for 91%. US crude oil WTI OIL long positions account for 81%, and EUR/USD long positions account for 53%. The “signal changes” since yesterday for these assets, as well as a more detailed list, can be found in the custom chart by Huitong Finance.
Position change signals include: 8 assets with expanded net long positions, 7 assets with reduced net long positions, 5 assets with expanded net short positions, and 5 assets with reduced net short positions. Assets with position ratios reaching or exceeding 80% include: spot gold XAU/USD (91% long), US crude oil WTI OIL (81% long), EUR/GBP (83% long), GBP/USD (81% short), USD/JPY (92% short), CAD/JPY (82% short), NZD/USD (82% long).
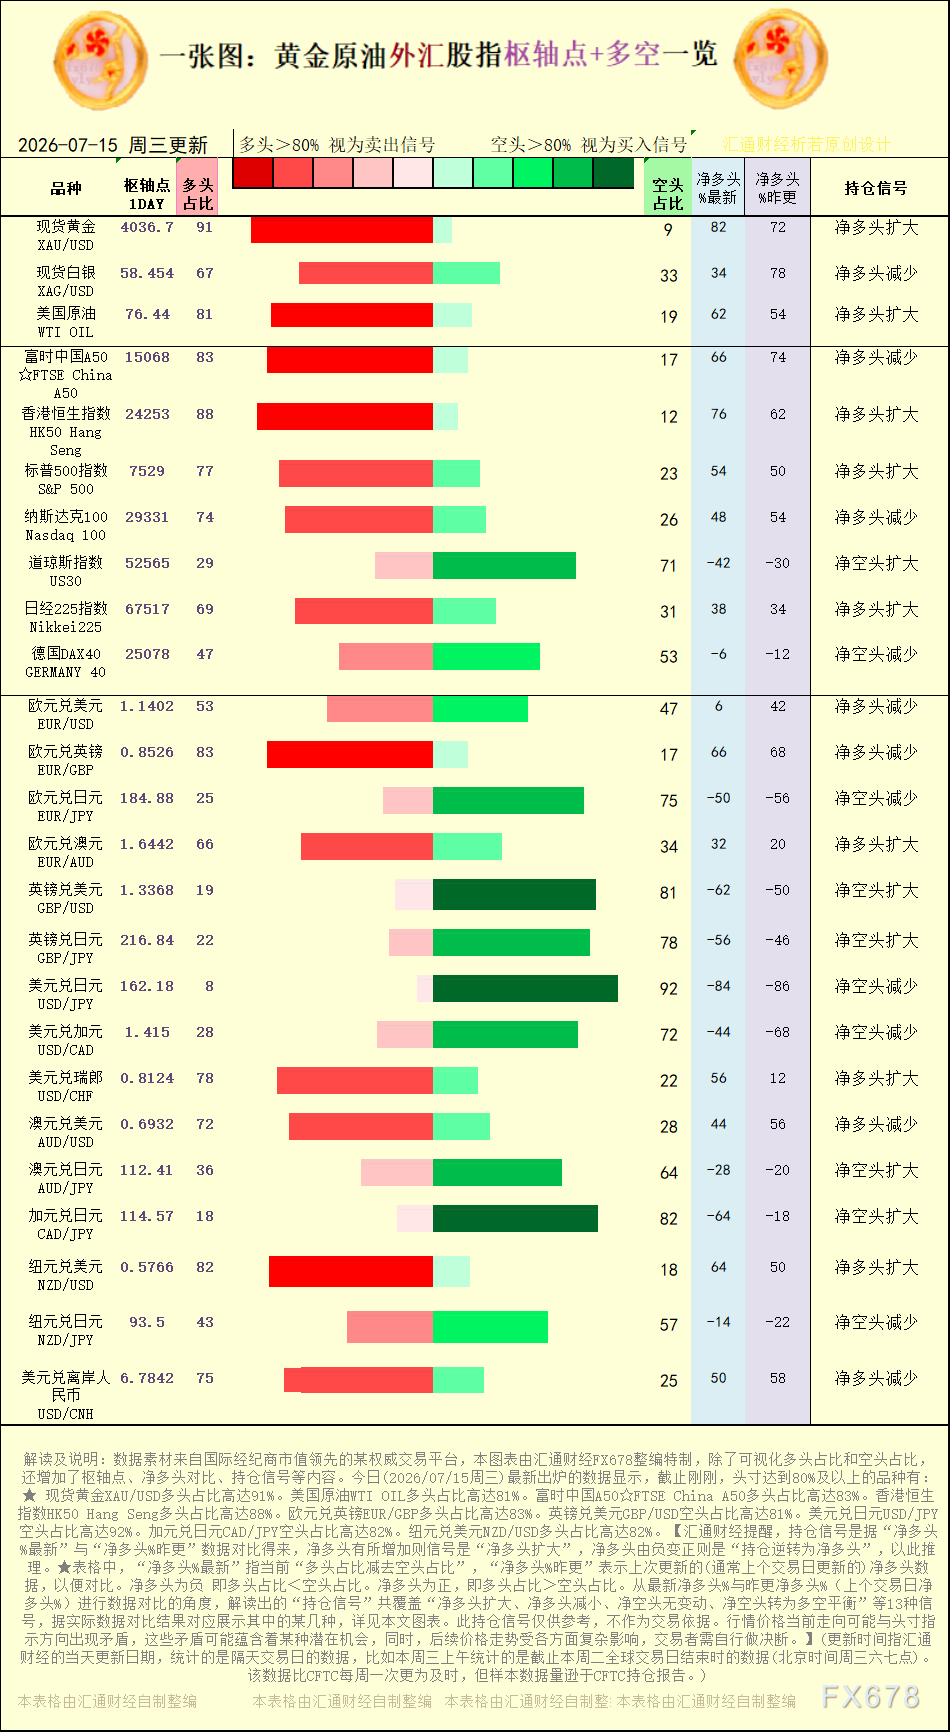
[Chart: Interpretation of Pivot Points and Long/Short Positioning Signals for gold, crude oil, forex, and stock indices, source: custom chart by Huitong Finance. (Click the image to enlarge)]
Assets with reduced net short positions include: Germany DAX40 GERMANY 40, EUR/JPY, USD/JPY, USD/CAD, NZD/JPY.
Assets with expanded net long positions include: spot gold XAU/USD, US crude oil WTI OIL, S&P 500 index, Nikkei225, EUR/AUD, USD/CHF, NZD/USD. Assets with reduced net long positions include: spot silver XAG/USD, Nasdaq 100, EUR/USD, EUR/GBP, AUD/USD, USD/CNH.
Huitong Finance reminds that positioning signals are derived from comparing “latest net long %” with “yesterday’s net long %”, and an increase in net long suggests a net long expansion signal; if net long turns from negative to positive, it indicates a reversal to net long positioning, and so on. In the table, “latest net long %” refers to the current value of “long position % minus short position %”, and “yesterday’s net long %” indicates the previously updated (usually prior trading day) net long figure for comparison. A negative net long means long positions proportion short positions proportion. From the perspective of comparing latest net long % to yesterday's figure, a total of 13 types of “positioning signals” can be interpreted, such as “net long expansion, net long reduction, no change in net short, net short turning to balance,” and several types are shown according to actual comparison results; see the accompanying chart for details. Current market price movements may sometimes contradict the direction indicated by positioning, and such contradictions may hold potential opportunities. Additionally, future price trends are influenced by many factors, so traders should make their own judgments.
[The trading instruments involved in this chart include: spot gold, spot silver, US crude oil, S&P 500 index, Nasdaq 100, Dow Jones index, Germany DAX40, EUR/USD, EUR/GBP, EUR/JPY, EUR/AUD, GBP/USD, GBP/JPY, USD/JPY, USD/CAD, USD/CHF, AUD/USD, AUD/JPY, CAD/JPY, NZD/USD.]
Disclaimer: The content of this article solely reflects the author's opinion and does not represent the platform in any capacity. This article is not intended to serve as a reference for making investment decisions.
You may also like

Australian Dollar declines to near 0.7150 as hot US inflation data boost case for Fed rate hike
The AI super bull market still has room for imagination, but Wall Street has quietly prepared "two types of insurance": to guard against slow declines eroding returns, as well as to protect from sudden crashes.
Due to rising interest rates and oil prices causing the stock market rally to stall, investors are divided—some worry about a rapid sell-off, while others are concerned about a slow market decline. Some traders have become more creative with bearish strategies, such as buying put options on the Chicago Board Options Exchange Volatility Index or the S&P 500, or using double binary options to bet on a gradual price drop.

Sui trades near $0.72 as TD Sequential flashes buy signal, support zone in focus
Crypto prices
More


