
A chart overview of commodity support and resistance: Gold, Silver, Oil, Gas + Platinum, Palladium, Copper, Agricultural Futures (July 16, 2026)

Huitong Finance, July 16 — A single chart shows the support and resistance for commodities: gold, silver, oil, gas + platinum, palladium, copper + agricultural futures, updated at 07:40 on Thursday, July 16, 2026 (UTC+8). It specifically covers 14 varieties including gold, silver, platinum, palladium, copper + crude oil, natural gas, gasoline + wheat, corn, cotton. For more details, refer to the custom charts in Huitong Finance Analysis.
A single chart shows the support and resistance for commodities: gold, silver, oil, gas + platinum, palladium, copper + agricultural futures, updated at 07:40 on Thursday, July 16, 2026 (UTC+8). It specifically covers 14 varieties including gold, silver, platinum, palladium, copper + crude oil, natural gas, gasoline + wheat, corn, cotton. For more details, refer to the content of Huitong Finance Analysis’s custom chart.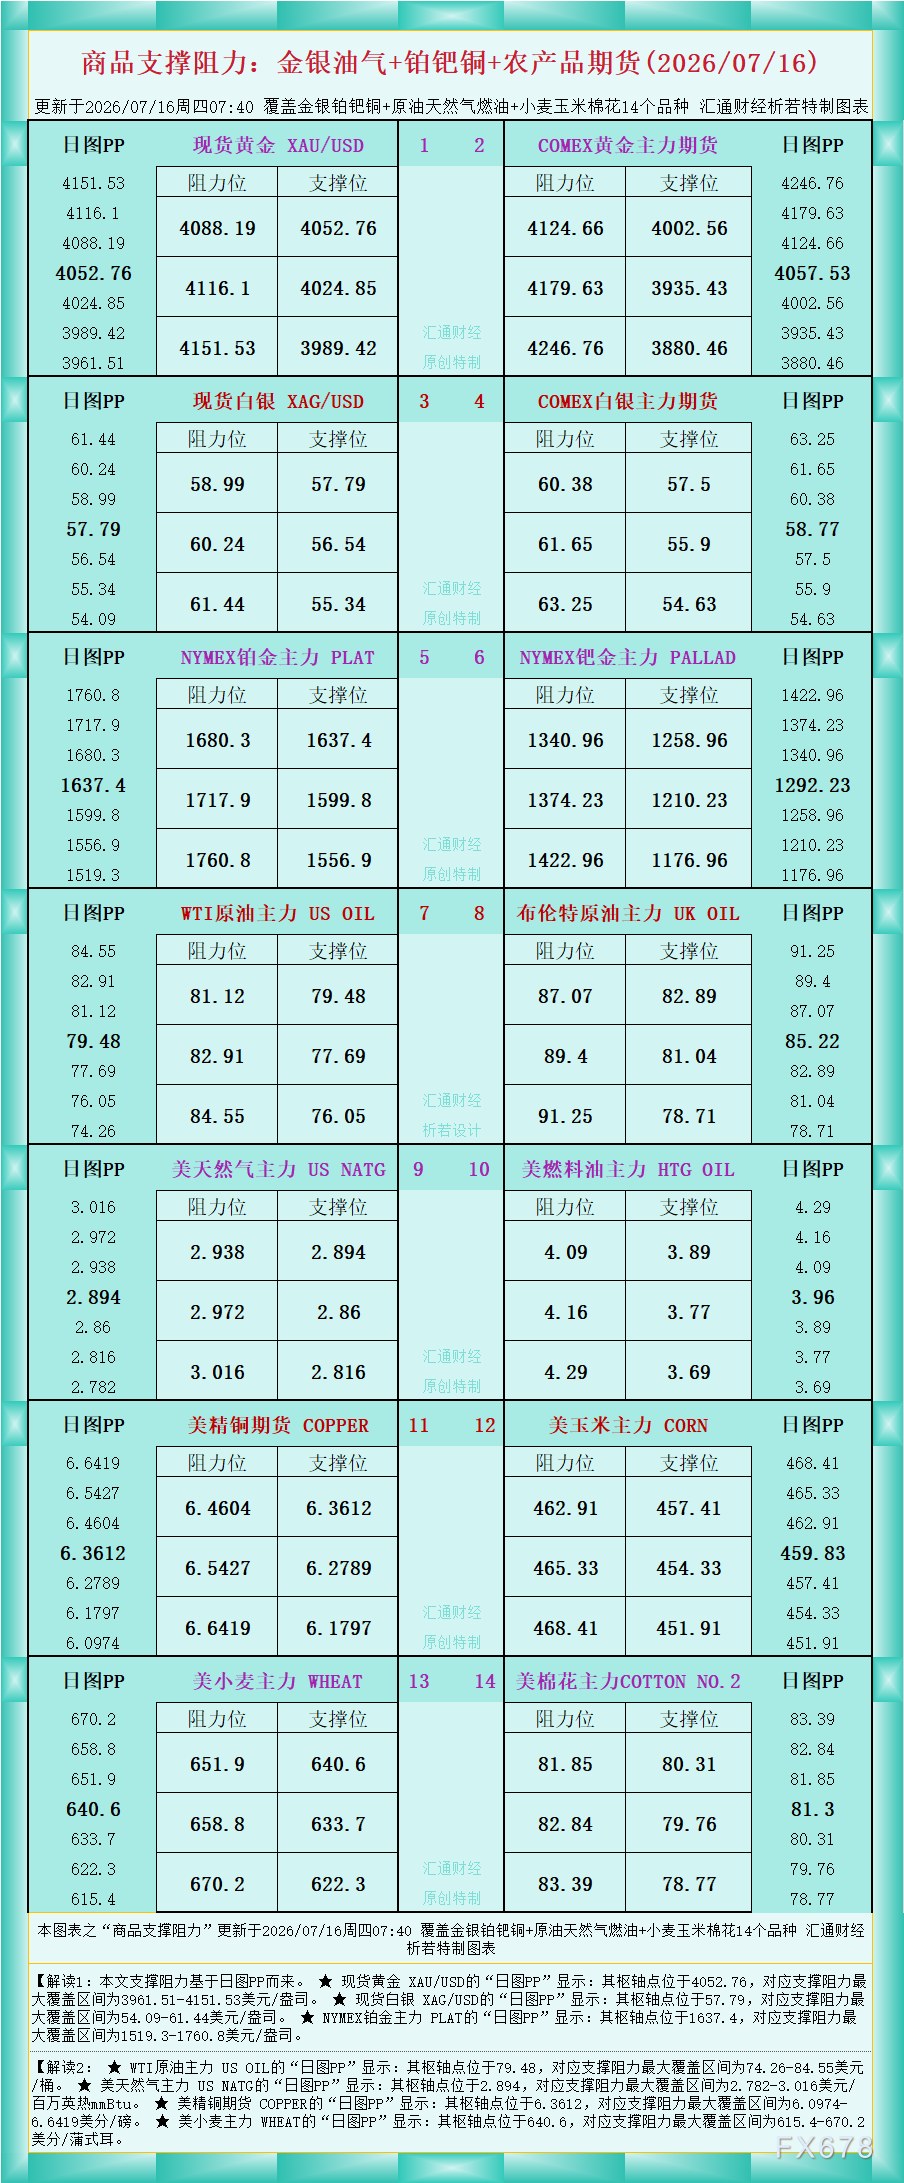
As shown in the chart data, Interpretation 1: The support and resistance in this article are based on Daily PP.
★ For spot gold XAU/USD, the “Daily PP” shows: the pivot is at 4052.76, with maximum support and resistance zone at 3961.51-4151.53 USD/oz.
★ For spot silver XAG/USD, the “Daily PP” shows: the pivot is at 57.79, with maximum support and resistance range at 54.09-61.44 USD/oz.
★ For NYMEX platinum main contract PLAT, the “Daily PP” shows: the pivot is at 1637.4, with maximum support and resistance zone at 1519.3-1760.8 USD/oz.
Interpretation 2:
★ For WTI crude oil main contract US OIL, the “Daily PP” shows: the pivot is at 79.48, with maximum support and resistance zone at 74.26-84.55 USD/barrel.
★ For US natural gas main contract US NATG, the “Daily PP” shows: the pivot is at 2.894, with maximum support and resistance zone at 2.782-3.016 USD/MMBtu.
★ For US copper futures COPPER, the “Daily PP” shows: the pivot is at 6.3612, with maximum support and resistance zone at 6.0974-6.6419 cents/lb.
★ For US wheat main contract WHEAT, the “Daily PP” shows: the pivot is at 640.6, with maximum support and resistance zone at 615.4-670.2 cents/bushel.
For more interpretations of varieties, please refer to the chart. Original and custom-made by Huitong Finance. All rights reserved. For reference only.
Disclaimer: The content of this article solely reflects the author's opinion and does not represent the platform in any capacity. This article is not intended to serve as a reference for making investment decisions.
You may also like

Australian Dollar declines to near 0.7150 as hot US inflation data boost case for Fed rate hike
The AI super bull market still has room for imagination, but Wall Street has quietly prepared "two types of insurance": to guard against slow declines eroding returns, as well as to protect from sudden crashes.
Due to rising interest rates and oil prices causing the stock market rally to stall, investors are divided—some worry about a rapid sell-off, while others are concerned about a slow market decline. Some traders have become more creative with bearish strategies, such as buying put options on the Chicago Board Options Exchange Volatility Index or the S&P 500, or using double binary options to bet on a gradual price drop.

Sui trades near $0.72 as TD Sequential flashes buy signal, support zone in focus
Crypto prices
More


